$GME BullishI cannot remember ever seeing such a bullish setup for NYSE:GME since starting to follow it in January 2021
Yes, there was 1 golden cross before,
Yes, there were many double bottoms before
Yes, there were many confirmed uptrends before
Yes, there were many solid gamma ramps before
Yes, it bounced off the MA200 once before
But all together? No
With that, UBS announced that they completed the take over of Credit Suisse and that they are going to get rid of the toxic assets. And we know that Credit Suisse inherited those from Archegos. And we know it caused the downfalls of both Archegos and Credit Suisse. And we know what caused the downfall of Melvin. And we know there are many others with toxic assets.
GME trade ideas

$GME taking offNYSE:GME had a double bottom and since them two higher lows confirming an upward trend.
It bounced off the 200 MA and is set to have a golden cross before next Wednesday.

$GMENYSE:GME backtesting massive HTF support after making a potential double bottom and higher low. Interesting stuff. Also not to mention breaks 200 day and back tests it as support.

I only see a huge FLAGHey traders! well, this is a very classic pattern and the earnings are Sep 05, 2023. also seems that it will be a golden cross soon between 50 & 200 MA. What do you think? APE in? YOLO?

GME's Accumulation CompleteNYSE:GME 's recent news (Cohen Chair and buying) seems to have dropped at the perfect time. The tape is reading bullish absorption of supply volume with higher lows and higher highs. If this is correct, Williams Alligator is showing the 'gator emas' eating to the upside on *THE WEEKLY*. This looks like squeeze territory anywhere above $30-32.

GME, UGLIEST DRAWING BUT STILL POSSIBLEI dare you find an uglier drawing but still have a high potential of achievement. This not a financial advice just trying to share my wishful thinking. ER on Tuesday be careful.
Please leave a comment of your thoughts and opinions.
Thanks

GME - Is Gamestop ready for another run ?GME this past week showed a nice reversal as seen on the 30 minute chart. Price hit a swing
low on May 2nd and then rose the rest of the week. Is it riding above the linear regression line
set to draw context and direction. On the anchored VWAP bands GME has crossed over the
first standard deviation VWAP line as well as the mean VWAP. Buying volume has replaced
selling volume in the past 3-4 sessions. GME crossed above the POC line of the intermediate
term volume profile suggesting buyers are taking control of the market
Please comment. What do you think? Is GME getting ready for another launch?

$GME - Huge bull flag - LongNYSE:GME -
We gave an entry at ~$19 on the 3rd higher low from the bottom of the flag -- Swinging on the monthly here we think big things here for GameStop
Swing to top of Flag and beyond!
Push Play / Like /Share / Comment!

GME: Falling Wedge Breakout to All-Time Highs is NearGME recently bounced from the lows on the lower timeframe thanks to a Bullish Gartley and a massive amount of MACD Bullish Divergence and it has since come back down to fill the gap the rise created; now that GME has filled that gap it is going for a second leg up and the RSI is entering the Bullish Control Zone, and soon it will be Bullishly breaking out a macro falling wedge pattern which if it breaks, I think could take it up to the levels of at least $120-$135

Gamestop may rally after a Bullish ConfirmationGameStop has entered an accumulation zone on the daily timeframe, indicating a period of consolidation and potential price reversal. To anticipate a bullish rally, confirmation of a breakout above this zone is necessary. Furthermore, there is a significant daily support level near the current market price, which has been preventing a downward break. Monitoring the price action and waiting for a bullish breakout confirmation will provide more clarity on the potential direction of GameStop's price movement.

Pullback or NOT?hi every one
complete pullback to the trendline with 30% profit Potential
The information provided on this Page does not constitute investment advice, financial advice, trading advice, or any other sort of advice and you should not treat any of the website's content as such. this page does not recommend that any cryptocurrency should be bought, sold, or held by you. Do conduct your own due diligence and consult your financial advisor before making any investment decisio

GME: Sell ideaSell idea on GME as you see on the chart because we have the breakout with force the vwap indicator and the breakout with force the support line by a big red candle with a large red volume.Thanks!

$GME A New Strategic VisionOn June 7th GameStop Corp. (NYSE: GME) fired its CEO Matt Furlong and appointed Ryan Cohen as the new executive chairman. These consecutive decisions were made after GME’s Q1 earnings report revealed a YoY decline in sales which caused the stock to plummet by 18.4%. The board’s decision to appoint Cohen on the other hand was likely due to three important reasons. The first is to avoid a power vacuum, the second is due to his popularity after the GME stock short squeeze, and the final reason is related to his outstanding business acumen. Given the board’s decision regarding Cohen, GME stock might be poised not only for a rebound but for a major run.
GME Fundamentals
Avoiding A Power Vacuum
Cohen’s new appointment as executive chairman comes with control over capital allocations, the authority to evaluate potential investments, as well as acquisitions, and an ability to oversee the managers of GME’s holdings. These executive powers solidify authority, and as a result, prevents a power vacuum from occurring in GME which would provide GME with stability until a new CEO is appointed.
Meme Stock King
The GME short squeeze was a momentous occasion as its + 2000% run represented a frustration with wall street corruption. In the midst of it all, Cohen who was a GME board member and a notable investor at the time, supported the short squeeze and became synonymous with the movement. His popularity skyrocketed on social media resulting in him becoming a figurehead in the meme stock community. His position within this community gives him an edge over other chairmen due to his trustworthiness and popularity among investors.
E-Commerce Expert
Throughout his career at GME, Cohen has constantly expressed that GME lacked a strategic vision due to its reliance on walk-in stores as opposed to online purchases. With that in mind, GME is now poised to take advantage of Cohen’s experience in the e-commerce sector thanks to his experience from his time as the CEO of Chewy, Inc. (NYSE: CHWY) where he elevated CHWY’s notoriety so much so that Petsmart purchased it for $3.3 billion.
That said, Cohen is likely to utilize his expertise in e-commerce in order to shift GME’s trajectory from a traditional retailer to an online tech-oriented retailer. A shift towards online purchases would likely result in a decrease in physical stores, which would cut expenses and increase profit margins due to a stronger focus on online purchases. In light of this, GME could return to profitability soon, which would reflect on the GME stock price.
Short Data
As things stand, GME stock is witnessing an increasing short selling activity with its short interest increasing to 20.5% and 28% of its float on loan. At the same time, GME’s utilization rate is at 100% indicating that there are no more shares available to be shorted. Given Cohen’s popularity as a meme stock figurehead, GME stock could witness a short squeeze given the excitement surrounding Cohen’s appointment as executive chairman.
GME Financials
According to its Q1 report, GME’s assets have decreased from $3.1 billion to $3 billion QoQ. Its cash balance also decreased during that time from $1.1 billion to $1 billion. Meanwhile, its liabilities remained stagnant at $1.79 billion.
As for revenues, GME’s net sales decreased YoY from $1.3 billion to $1.2 billion while its expenses decreased from $453 million to $345 million. As a result, GME’s net loss improved YoY from $157 million to $50 million.
Technical Analysis
GME stock is in a bullish trend with the stock trading in an upward channel which the stock broke following its disappointing Q1 earnings. Looking at the indicators, GME is trading below the 200, 50, and 21 MAs which are bearish indications. Meanwhile, the RSI is neutral at 62 and the MACD is neutral as well.
As for its fundamentals, GME recently witnessed 2 catalysts in its disappointing Q1 earnings, which has seen the stock plummet 20% in after hours and pre-market trading, and the appointment of Cohen as executive chairman. Given Cohen’s reputation and popularity among investors, GME stock could be poised to soar in the near term.
GME Forecast
Sometimes dips could be a great opportunity to invest which might be the case for GME stock given that Cohen was appointed as executive chairman. Through Cohen’s e-commerce expertise and popularity among investors, GME stock could witness a short squeeze soon as the company might be set to improve its financial situation significantly if it starts to focus on online sales. In this way, GME may return to profitability under Cohen’s guidance which could reflect on the GME stock price.

GME GameStop Options Ahead of EarningsAnalyzing the options chain of GME GameStop prior to the earnings report this week,
I would consider purchasing the 25usd strike price Calls with
an expiration date of 2023-6-16,
for a premium of approximately $1.83.
If these options prove to be profitable prior to the earnings release, I would sell at least half of them.
Looking forward to read your opinion about it.

GME: Good uptrendOn GME as you see on the chart we will have a big probability to have a good uptrend after the breakout with force the vwap and the resistance line by a big green candle with a large green volume.Thanks!

$GME - 741 is not a drill, its a Algorithmic Timeline
This idea is a fun one for the tinfoilers out there.
NYSE:GME There are many ideas behind 741 and its meaning, however one pops up frequently in my own head, and its the estimated timeframe of 741 days and how it plays into the stock itself. It's a 741 day shorting algorithm, which is set when you see an initial shorting of a stock. At the end of the 741 days, you will often see a spike in price, known as a sneeze, and a rise of price upwards the weeks prior.
741 days before the initial squeeze dates back to Tuesday January 15, 2019. Coincidentally enough, this is also roughly the same week GME had a retest before being shorted into oblivion.
Now given the extreme pile on of retail, and the potential derailing of an algorithm, a buffer zone has been applied to the next shorting phase, approximately June 7th after the At-The-Market Equity Offering Program.
741 days after the initial offering of the Stock Sale, leads us to June 18, 2023, which would lead me to believe that there will be a price movement upwards around this time, and this prior weeks leading up will fluctuate into the $30 dollar range, starting this week.

GME: Buy ideaBuy idea on GME as you see on the chart because we have the breakout with force the vwap by a big green candle with a large green volume.Thanks!

$GME The Rise of The Players (Monthly)
NYSE:GME view on the monthly showing support/resistance test points. This goes along with the (weekly) chart posted yesterday.

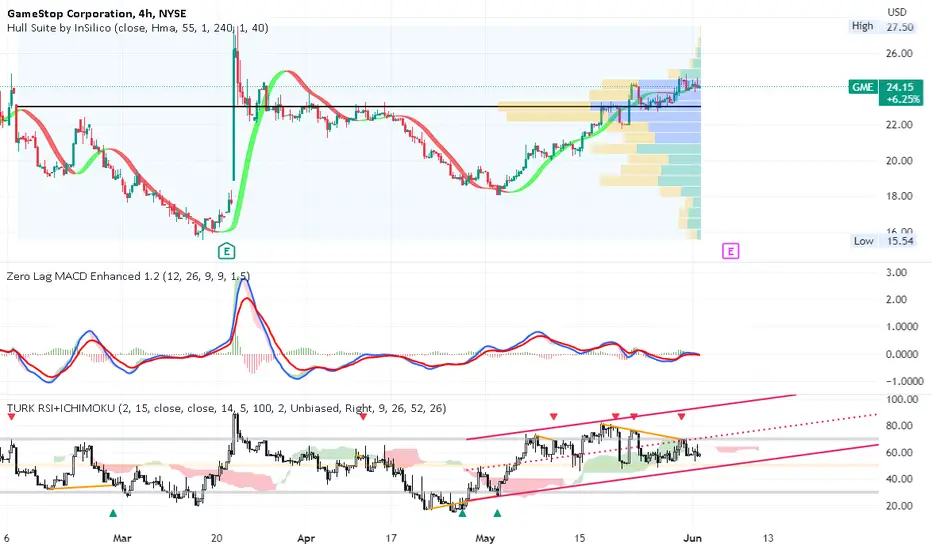
GME appears to be ready to sell in JuneGME on the 4H chart appears to have topped out at the end of May after a decent rise of
30% after the May 2nd bottom. At present, the Hull Suite trend indicator is signaling a
reversal while the MACD zer0 lag indicator shows the lines have crossed under the horizontal
zero and the histogram has turned red. The RSI Indicator is showing a bearish divergence with
strength decreasing from 80 to 60. I see this as a short setup and will take a position of
put options with some long stock shares as risk management and hedging strategy. My target is
a 50% retracement of May's move up and a stop loss above the swing high. GME is still above
the POC line of the volume profile. Once it drops to that value, I expect bearish momentum
acceleration. Earnings are coming. If in profit before earnings, I will take off half the position
for the earnings and then expect GME to rise and stop out the remaining position or drop
quite a bit more.
GME about to Blast some Ass GME about to Blast some Ass GME about to Blast some Ass GME about to Blast some Ass GME about to Blast some Ass GME about to Blast some Ass GME about to Blast some Ass GME about to Blast some Ass GME about to Blast some Ass GME about to Blast some Ass GME about to Blast some Ass GME about to Blast some Ass GME about to Blast some Ass GME about to Blast some Ass GME about to Blast some Ass GME about to Blast some Ass GME about to Blast some Ass GME about to Blast some Ass GME about to Blast some Ass GME about to Blast some Ass GME about to Blast some Ass GME about to Blast some Ass GME about to Blast some Ass GME about to Blast some Ass GME about to Blast some Ass GME about to Blast some Ass GME about to Blast some Ass GME about to Blast some Ass GME about to Blast some Ass GME about to Blast some Ass GME about to Blast some Ass GME about to Blast some Ass GME about to Blast some Ass GME about to Blast some Ass GME about to Blast some Ass GME about to Blast some Ass GME about to Blast some Ass GME about to Blast some Ass GME about to Blast some Ass GME about to Blast some Ass GME about to Blast some Ass GME about to Blast some Ass GME about to Blast some Ass GME about to Blast some Ass GME about to Blast some Ass GME about to Blast some Ass

$GME Long - The Rise of The Players (weekly)
Short and Sweet, NYSE:GME technicals don't really work all that well cause everyone forgets NYSE:GME is not in here with investors; Investors are in here with NYSE:GME , and it runs the show.
With that said, its hard not to notice patterns, alongside potential predatory short hedge fund tactics, alongside old shorting algorithms, alongside activist investors also noticing something off and taking massive advantage of it during a time in technology where everyones ideas can be connected. it's an odd stock, because people paid attention to the oddities and pointed it out, giving a large upper hand to executives behind Gamestop having a massive following of truly invested shareholders who have a safe haven to expand their knowledge on markets.
So, Gamestop has become profitable recently, there is no stopping that train which is steamrolling through market share where Amazon and other competing Tech type companies could not. Gamestop has a massive following by which Gamestop made it safe for new retail investors, to invest and gain knowledge on the inner workings of the real (fake) stock market (this alone proves stocks are often at the hand of predatory short sellers who cellar box companies into the ground for competition like Amazon to take over their market share). Gamestop already has a nft store, and they have noticed a majority of their profit coming from collectibles, old games, and new trends with massive cash backing i.e. web3. Gamestop is providing a one stop shop / web3 integrated gaming launcher and atmosphere, where any games played on web3 can be played through their launcher, prioritizing network and data traffic, while getting rid of 34231 other launchers in the process, seamlessly onboarding web2 to web3. Gamestop has both online and brick and mortar presence with a tonne of cash set aside for purchasing, which they mention in their last filing that purchasing was on their agenda.
The stock itself is approaching an extremely familiar deep value territory similar to 2020 (as shown by the purple squares) . If you have paid attention to all the short players during that time frame, a majority of them, and many other investors went long in their large positions on Gamestop. Still means shorts have to close, but they've now likely hedged their shitty old bet, attempting to reduce their casualties for their actions.
Looks like your sweet little baby NYSE:GME is finally going to get the needed attention it deserves from its loving fanbase instead of its neglectful caretakers beforehand.
Lastly, If you were to scrape away all the bullshit over the last few years, learned to DRS your shares, constantly grew your knowledge on the market, you would understand that NYSE:GME is more than a squeeze, its more than a play, its bringing power back to the players.
(If you're curious, I set two trend lines all the way back from the start of the stock, one sits roughly at $15.60 where there were 3 tests breaking on the 3rd (DFV "Squeeze"), and one sits starting at $7.41 with the trend line matching the end of the wedge provided over the last 3ish years. the 15.60 line has been tested again 3 times since the initial pump, and bounced each time, with the last leading to consitent rise in price).
NFA, some fun lines, patterns, and opportunities looking like they're being taken advantage of by Gamestops team.

Gamestop, MEME Stocks, DRSGamestop...
Ok full disclosure..i absolutely made some money in the Gamestop mania of a couple years ago
I think evidence is overwhelming that abusive short selling practices are a cancer in our markets that needs to be weeded out (how many weeks has Gensler been on the job now lol?)
With that said GME is different that other so called meme stocks because of the lemming like madness that has ensued on Reddit concerning the Direct Registering (DRS) of GME stock
I'll let you ignite your GPT inquiries and Google searches (do people still do those? j/k..sorta) to better understand the thesis behind DRS and GME
With that said mania is mania and sentiment is sentiment...
LONG GMERICA ..oops sorry...I mean GME!

GMEInteresting spot for GME. Closing in on the $24 level that held as support in Q3/Q4 2022 then flipped to resistance. Also running into 61.8 retracement from the recent earnings gap up/sell off. Finally, the blue trend line dates back almost 2 years. No position for me currently. Earnings in 1.5 weeks.
