GSK Breakout Trade – Clean Setup AheadPattern: Bullish breakout from descending wedge
Entry Zone: Around $4.83–$4.97
Stop Loss: Just below $4.70 (trendline + horizontal support)
Target: $5.18 (green resistance level)
GSK/N trade ideas

$GSKA potential "ABC" pattern has been located here at a level where two previous support levels were broken. Price is near the 11-2023 support level. Looking for a retracement here to two targets overtime.

GSK 1-2 wk swing IdeaNYSE:GSK has set of a daily trigger with a 5/10 ema crossover after a positive earnings report.
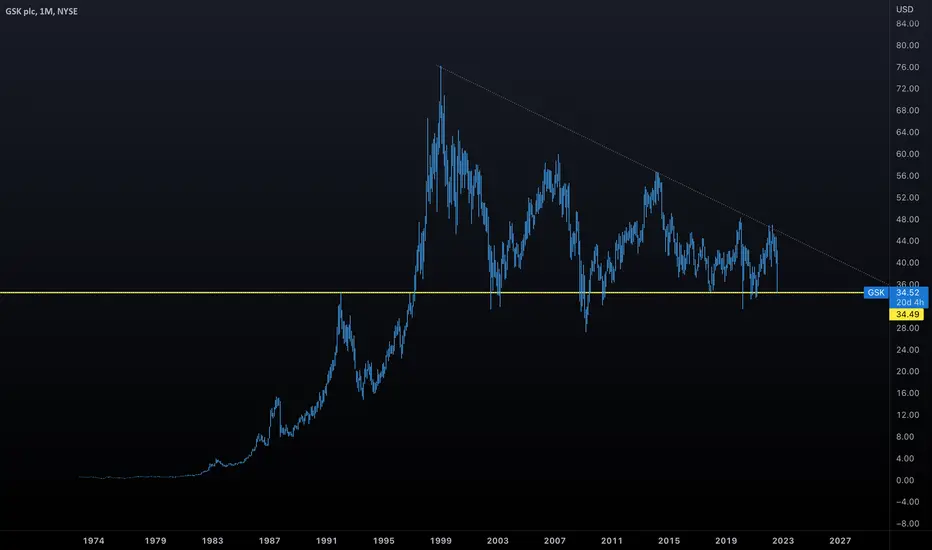
During my planning for this idea, I needed to zoom WAY out to the monthly chart in order to understand these levels a bit more. Screen shot of the monthly below:
It turns out that last week's close put the stock right at a very long-standing Point of Control (yellow line) that has formulated from the March '97 breakout all the way until Friday, August 9th, 2024. That's over 27 years worth of trading. With that said, I'm not necessarily looking to play the monthly (yet).
The main idea came from the daily and weekly looks, which is why I'm looking for only a 1-2 week swing for now. Weekly screen shot below:
I'd love to enter closer to that 39.75 area, so I'll monitor this Monday to see if we get a pullback, but I'm also happy with the current price of ~40.26.
Each level is noted on the chart, and I'll be looking at the Sept 40c or 41c as they've had some action recently, although this is not a super high volume options chain as it is.
I will be checking on the OI Monday to see how that volume on Friday played out.
IF this stock gets to the full exit level of 43.31 and it's showing continued strength, I may leave a runner or 2 so long as it's just a small % of profits.
FWIW, I also like the Jan '26 42c LEAPS. Given how this name moves, that might actually be the more safer route, and could be held for the potential monthly pattern breakout idea. One could also trade the Sept chain, then roll out to the LEAPS with profits.

GSKNot a recommendation. Held this for a while with very little movement, now GSK as started going up, div yield is over 3.3%

Long GSK - Euro Drug Hype Cycle approachesPlaying short term trade presuming positive news in a week or two.
Shares would return to the range highs near $37.00
Ex-Dividend Date later this week

GSK (GSK) Outperformed Market ReturnsIn the latest trading session, GSK (GSK) closed at $37.10, marking a +1.23% move from the previous day. The stock exceeded the S&P 500, which registered a gain of 0.63% for the day. Elsewhere, the Dow gained 0.59%, while the tech-heavy Nasdaq added 0.39%.
Prior to today's trading, shares of the drug developer had gained 0.27% over the past month. This has outpaced the Medical sector's loss of 1.62% and the S&P 500's loss of 3.39% in that time.

GSK looking bullish! Buy volume at resistance at this point in the falling channel should help propel the price to an initial measured target if $47 which would be thr breakout point of an even bigger bullish macro setup.

GSK with a bullish outlook following its earnings #StocksThe PEAD projected a bullish outlook for GSK after a negative over reaction following its earnings release placing the stock in drift C with an expected accuracy of 80%.

Long Glaxo Smith Kline (NAS:GSK) looks very good risk returnUsing longer term Auction Market Theory to construct longer term meaningful #VolumeProfiles can sometimes provide exceptional risk reward setups.
One has just popped up in GSK according to my read anyway.
Now price has returned into the longer term Value Area there's a very good chance price will return at least to the Point of Control (or even to the top of the Value Area).

$GSK: Weekly trend signalGreat reward to risk in this weekly chart setup in $GSK, worth a shot, you can probably play it with options to not allocate too much capital in this idea and have limited downside risk. An ITM put spread or some kind of Iron Butterfly OTM can both reap the passage of time profiting from Theta dropping and also give a positive reward to risk if carefully implemented. Target zone is 41.35 by mid to late April.
Best of luck!
Cheers,
Ivan Labrie.

$GSK with a Bullish outlook following its earnings #Stocks The PEAD projected a Bullish outlook for $GSK after a Positive over reaction following its earnings release placing the stock in drift B.

Good Entry for Long Term InvestmentGSK plc, together with its subsidiaries, engages in the creation, discovery, development, manufacture, and marketing of pharmaceutical products, vaccines, over-the-counter medicines, and health-related consumer products in the United Kingdom, the United States, and internationally. It operates through four segments: Pharmaceuticals, Pharmaceuticals R&D, Vaccines, and Consumer Healthcare. The company offers pharmaceutical products comprising medicines in the therapeutic areas, such as respiratory, HIV, immuno-inflammation, oncology, anti-viral, central nervous system, cardiovascular and urogenital, metabolic, anti-bacterial, and dermatology. It also provides consumer healthcare products in wellness, oral health, nutrition, and skin health categories. The company offers its consumer healthcare products in the form of nasal sprays, tablets, syrups, lozenges, gum and trans-dermal patches, caplets, infant syrup drops, liquid filled suspension, wipes, gels, effervescents, toothpastes, toothbrushes, mouthwashes, denture adhesives and cleansers, topical creams and non-medicated patches, lip balm, gummies, and soft chews. It has collaboration agreements with 23andMe; Lyell Immunopharma, Inc.; Novartis; Sanofi SA; Surface Oncology; Progentec Diagnostics, Inc.; Alector, Inc.; and CureVac AG., as well as strategic partnership with IDEAYA Biosciences, Inc. and Vir Biotechnology, Inc. The company was formerly known as GlaxoSmithKline plc and changed its name to GSK plc in May 2022. GSK plc was founded in 1715 and is headquartered in Brentford, the United Kingdom.
This is hitting 20 year lows. Since it is based in the U.K., I bet it will do better as the EURUSD does better against the @ dollar DXY
Do your own due diligence

$GSKHas spent almost as much time correcting as in its advance , declines are with volume ...low is not in

GSKI do not provide personal investment advice and I am not a qualified licensed investment advisor.

GSK: The line of support!Will GSK hold this line? The ex div date is fast approaching, looks like a BUY on price action!
My opinion only, not financial advice!

Long the Support Retest for 50% upside into 2024-2025This is a low risk high reward gem.
90,000 employees is too many, look for a lay-off announcement to drive down price allowing for an ideal entry at $30.00


GSK - Zantac - Haleon MessGSK technically at Jan 1992 Support/Resistance level.
On news of the Zantac issue.
This presents what could be a descending triangle pattern.
Will they be able to walk away from this horrible situation (for those that have consumed the original Zantac there are no words to describe)?
$GSK with a Bullish outlook following its earnings #Stocks The PEAD projected a Bullish outlook for $GSK after a Positive Under reaction following its earnings release placing the stock in drift B.

GSK Death Cross my be hugely bullish after all !GlaxoSmithKlein (GSK) just formed a Death Cross on the 1D time-frame, which is when the 1D MA50 (blue trend-line) crosses below the 1D MA200 (orange trend-line). This is technically a bearish pattern but last time it formed (March 24 2020) was exactly on the bottom of the COVID crash and the price recovered rapidly.
That was of course in the aftermath of the massive economic package in an attempt to support the economy from the lockdown but even now there is upside potential and some levels to consider on the short-term.
As you see, since April 11, the stock has been trading within a perfect Channel Down. This indicates a systematic downtrend. As long as the 1D MA50 holds, such rises are sell opportunities towards a Lower Low, in which case its on the 0.236 now. Since we are trading so close to the 1D MA50, a tight sell now with the SL located at the top of the Channel Down, has an excellent Risk/ Reward ratio.
Similarly, if the price breaks above the top of the Channel Down, the R/R is favorable in going on a tight buy targeting the upper Fibs and ultimately the 47.00 Resistance. Notice how the 1D RSI bounced off near the 30.00 oversold level, which has initiated massive rebounds another 4 times within the long-term Channel Up.
--------------------------------------------------------------------------------------------------------
** Please support this idea with your likes and comments, it is the best way to keep it relevant and support me. **
--------------------------------------------------------------------------------------------------------

can be upwardwe have a 2 secnario in this chart
secnario 1 : the big correction can be finished on 27.14
secnario 2: correction van be continues in the form of triangle
and we are currently now in WD wave of triangle.

CURE FOR CANCER?
There is currently a race on for the development of viral pharma (re-engineering virus' to benefit humanity, specifically in this case to defeat cancer)
There are several players, but GSK is one of the biggest and in the lead...
The preliminary results do sound interesting!

GSK breakout on high volume. All slow stochastic, CCI, and RSI indicators are giving buy signal. A nice green candle with a large volume yesterday could be a breakout!
