GT - LONG TERM INVESTMENT If someone is looking for a long term investment I like GT.. I always look for companies that won't go out if business, have a strong brand name and pay a dividend that is likely to not get cut while you wait.. This hits every one. You can wait a little longer but this looks like a great spot to get in.
GT trade ideas

Long play with 15.20 as stopPotential long play here as reversal of downtrend is forming. Recent highs have broken the last value area of the downtrend (rectangle in chart). Could get a play back to ~17.30

A beautiful triple top reversal pattern. What a great short opportunity. The triple top reversal pattern is a great bearish pattern that short sellers love. My entry target is $14 to $14.50 with a stop at $14.75 and a target of $11.50

Bearish on the weekly chart. Weekly chart with bollinger bands revealed a spinning top just under the middle band on an established downward trend. January $14 long puts are looking pretty tasty. My exit target is $11 please do your own DD

Good opportunity to go LONGGood Year Tires good opportunity to go long with bullish candle stick pattern confirmation and MACD confirmation to buy in, an expected consolidation will occur for another trace in. GT has been respecting 100 EMA and 10 EMA crossovers, next crossover would indicate a strict exit confirmation to sell long positions.

DO NOT HAVE TIME FOR DESCRIPTION, JUST SHORT GT FROM LEVELDO NOT HAVE TIME FOR DESCRIPTION, JUST SHORT GT FROM LEVEL
I HAVE REALLY SKILL IN SHORT GT TWICE AND RESULT WAS VERY WELL.
TODAY, I ANNOUNCED MY IDEA TO PUBLIC SHORT GT, I THINK THAT IS BEST IDEA,
I EXPECTED ABOUT 33% PROFIT FROM THIS DEAL, STOP LOSS OR ANOTHER POINT FOR RISE POSITION TO LONG I SEE 15.95,
SO STOP LOSS IS ABOUT 9% FOR CURRENT PRICE.


We still go down! (Daily Analysis)You can check my parallel channel at one week Analysis. This is only for some details.


GT- REVERSAL Notice it respected the trend line on the monthly chart and had a multiple bottom at $11. The MACD is curling up on the daily and has already crossed on the 55min.
Started my position with some $11 October 18 calls and will add on the break of 11.81 (.236 Fib)


GT appraoching support, potential bounce! GT is approaching our first support at 16.36 where we might see a bounce in price to our first resistance at 18.52.
Stochastic is also approaching support where we might see a corresponding bounce in price.

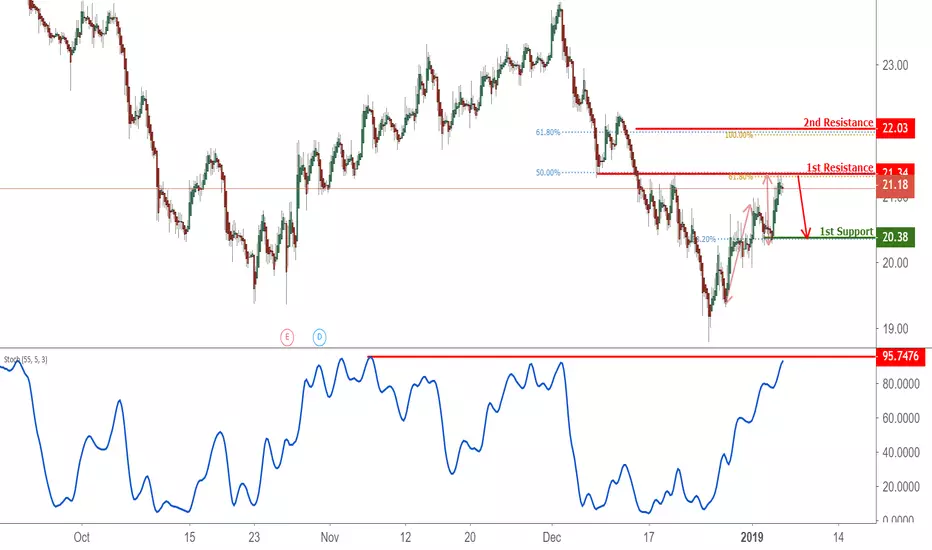
GT Approaching Support, Potential Bounce!GT is approaching support where a potential bounce to its resistance could occur.

GOODYEAR Tire & Rubber LongTrading in Downward Channel
rejected/bounced multiple times
Long position
Counter - Trend
Tight Stop loss (1%)

GT Approaching Support, Potential Bounce!GT is approaching support where a potential bounce to its resistance could occur.


GT Reversal?GT looks to be reversing. Red line is stop loss at 18.55, Entry at 18.80, suggested exit at 20.20. Quick swing trade I am looking at.


GT Approaching Support, Potential Bounce!GT is approaching our first support at 18.86(horizontal overlap support, 61.8% fibonacci retracement) where a strong bounce might occur above this level pushing price up to our major resistance at 25.72 (horizontal pullback resistance, 100% fibonacci extension, 38.2% fiboancci retracement).
Stochastic (55,5,3) is also seeing a bullish divergence and appraoching support where we might see a corresponding bounce above this level.


GT Approaching Support, Potential Bounce!GT is approaching our first support at 61.8% fibonacci retracement (horizontal overlap support, 61.8% fibonacci retracement) where a strong bounce might occur pushing price up to our major resistance at 23.50 (horizontal swing high resistance, 23.6% fibonacci retracement, 61.8% fibonacci extension).
Stochastic (55,5,3) is also approaching support and seeing a bullish divergence and we might see a corresponding rise in price.
