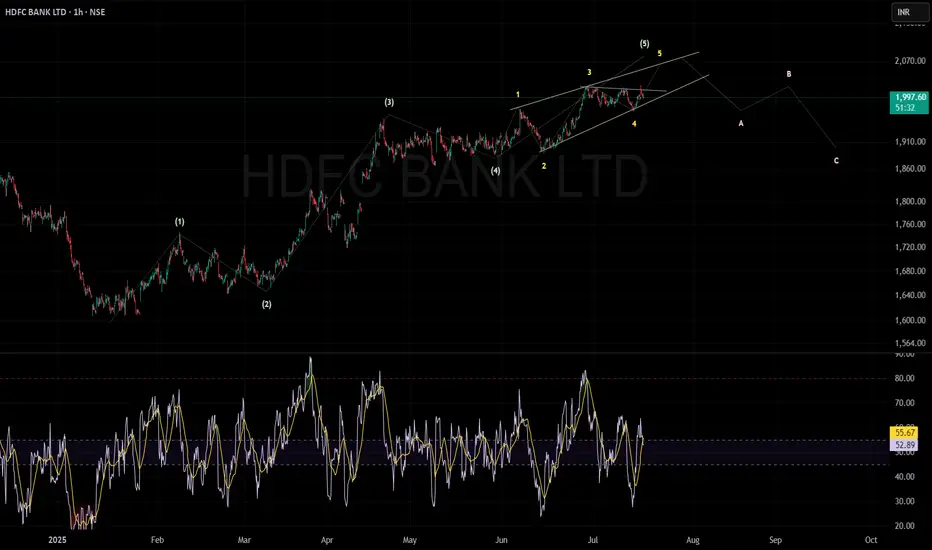
HDFC BANK can move 5th wave upHDFC Bank is currently in the last (5th) wave of an uptrend. This wave is moving inside a narrow, rising wedge pattern called an ending diagonal.
The price can move higher towards ₹2,050–₹2,100 before the trend finishes.
If the price breaks below the bottom of the wedge pattern (ending diagonal),
Key facts today
Next report date
—
Report period
—
EPS estimate
—
Revenue estimate
—
61.07 MXN
171.54 B MXN
1.15 T MXN
2.56 B
About HDFC BANK LTD
Sector
Industry
CEO
Kapila Deshapriya
Website
Headquarters
Mumbai
Founded
1994
FIGI
BBG00JX0QYS8
HDFC Bank Ltd. engages in the provision of banking and financial services including commercial banking and treasury operations. It operates through the following segments: Treasury, Retail Banking, Wholesale Banking, and Other Banking Business. The Treasury segment is involved in net interest earnings from the investment portfolio, money market borrowing, and lending, gains, or losses on investment operations and on account of trading in foreign exchange and derivative contracts. The Retail Banking segment focuses on serving retail customers through the branch network and other channels. The Wholesale Banking segment provides loans, non-fund facilities, and transaction services to large corporates, emerging corporates, public sector units, government bodies, financial institutions, and medium scale enterprises. The Other Banking Business segment includes income from parabanking activities such as credit cards, debit cards, third party product distribution, primary dealership business, and the associated costs. The company was founded by Aditya Tapishwar Puri in August 1994 and is headquartered in Mumbai, India.
Related stocks
hdfc bank on side way formation hdfc bang today formed a negative pattern can go in consolidation for a while trendline support is good and needs to sustain above it for positive trend hold

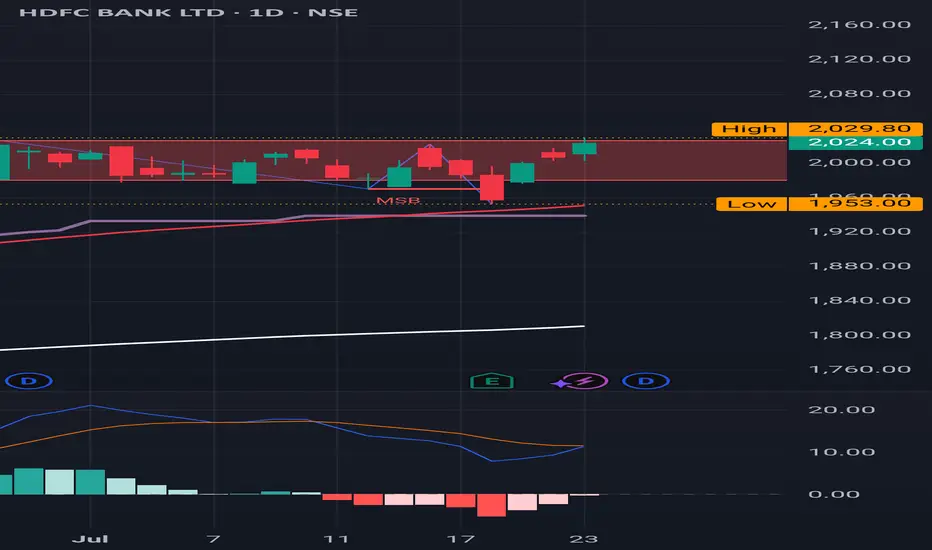
HDFC Bank : Sitting at a major Red Band Resistance
HDFC Bank : Sitting at a major Red Band Resistance
Daily Time Frame.
( Not a Buy / Sell Recommendation
Do your own due diligence ,Market is subject to risks, This is my own view and for learning only .)
HDFC Bank BuyHDFC Bank bounced back from its trend line. also break above a consolidating range. Buy @CMP (2015) with SL of 1960 and a target of 2500.

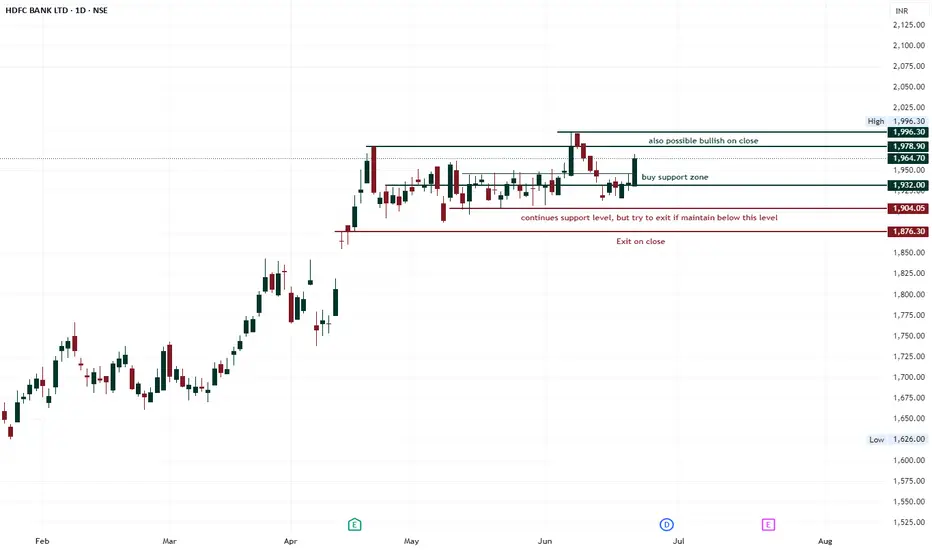
hdfc bank reportbullish pattern with candle pattern. every time support 1905 level, but no break to 1876
HDFC BANK - Will Go up?So my indian friends yet again has asked for this discretion, I feel the gap will be filled today or slow chop, the move is due to the ceasefire, since the last time i posted, it went very high

HDFCBANK - For my Indian Viewers!So an Indian Viewer has asked for this, so looking onto it, the heavyweight of sector NIFTY would see a move as stated!

HDFC Accumulation Breakdown Setup?HDFC seems to be building an accumulation range with:
Range High: ₹1955
Range Low: ₹1908
Currently, price is consolidating within this zone. I'm biased to the sell side for now, expecting a potential breakdown below the ₹1908 level.
⚠️ No confirmation yet — it's a “wait and watch” scenario. A st

HDFC Bank ExitHDFC Bank 1933 is overbought. Support 1 @1893 and support 2 at 1818.
For investment it is trading at 20 PE and would be look good at 17.3 PE which would be 1600.

HDFC BANK ANALYSIS – 1H TIMEFRAMENSE:HDFCBANK
Symmetrical Triangle Pattern Forming
A breakout or breakdown is likely soon. Price is consolidating within the triangle range.
HDFC BANK ANALYSIS ON 1 HOUR TIME FRAME
IMPORTANT LEVELS TO WATCH:
Resistance: 1941 – 1958 – 1970
Support: 1913 – 1898 – 1885
📌 Chart Pattern: Pr

See all ideas
An aggregate view of professional's ratings.
Neutral
SellBuy
Strong sellStrong buy
Strong sellSellNeutralBuyStrong buy
Neutral
SellBuy
Strong sellStrong buy
Strong sellSellNeutralBuyStrong buy
Neutral
SellBuy
Strong sellStrong buy
Strong sellSellNeutralBuyStrong buy
Displays a symbol's price movements over previous years to identify recurring trends.
Curated watchlists where HDB/N is featured.

Indian stocks: Racing ahead
46 No. of Symbols
See all sparks
Frequently Asked Questions
The current price of HDB/N is 1,445.00 MXN — it has increased by 13.60% in the past 24 hours. Watch HDFC BANK LIMITED stock price performance more closely on the chart.
Depending on the exchange, the stock ticker may vary. For instance, on BIVA exchange HDFC BANK LIMITED stocks are traded under the ticker HDB/N.
We've gathered analysts' opinions on HDFC BANK LIMITED future price: according to them, HDB/N price has a max estimate of 1,787.17 MXN and a min estimate of 1,266.91 MXN. Watch HDB/N chart and read a more detailed HDFC BANK LIMITED stock forecast: see what analysts think of HDFC BANK LIMITED and suggest that you do with its stocks.
HDB/N stock is 12.14% volatile and has beta coefficient of 0.37. Track HDFC BANK LIMITED stock price on the chart and check out the list of the most volatile stocks — is HDFC BANK LIMITED there?
Today HDFC BANK LIMITED has the market capitalization of 3.70 T, it has increased by 1.10% over the last week.
Yes, you can track HDFC BANK LIMITED financials in yearly and quarterly reports right on TradingView.
HDFC BANK LIMITED is going to release the next earnings report on Oct 20, 2025. Keep track of upcoming events with our Earnings Calendar.
HDB/N earnings for the last quarter are 15.45 MXN per share, whereas the estimation was 14.92 MXN resulting in a 3.55% surprise. The estimated earnings for the next quarter are 14.57 MXN per share. See more details about HDFC BANK LIMITED earnings.
HDFC BANK LIMITED revenue for the last quarter amounts to 115.57 B MXN, despite the estimated figure of 94.57 B MXN. In the next quarter, revenue is expected to reach 94.44 B MXN.
HDB/N net income for the last quarter is 35.63 B MXN, while the quarter before that showed 44.54 B MXN of net income which accounts for −20.01% change. Track more HDFC BANK LIMITED financial stats to get the full picture.
HDFC BANK LIMITED dividend yield was 1.00% in 2024, and payout ratio reached 20.12%. The year before the numbers were 1.06% and 18.08% correspondingly. See high-dividend stocks and find more opportunities for your portfolio.
As of Jul 26, 2025, the company has 214.55 K employees. See our rating of the largest employees — is HDFC BANK LIMITED on this list?
Like other stocks, HDB/N shares are traded on stock exchanges, e.g. Nasdaq, Nyse, Euronext, and the easiest way to buy them is through an online stock broker. To do this, you need to open an account and follow a broker's procedures, then start trading. You can trade HDFC BANK LIMITED stock right from TradingView charts — choose your broker and connect to your account.