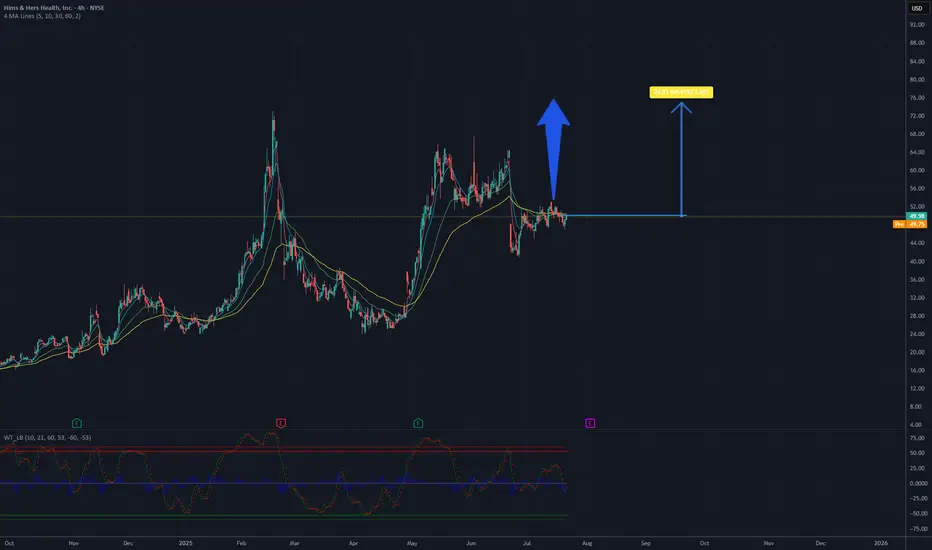
Is it a time for HIMS? Potential 50%,target 75USD.The company has announced plans to introduce comprehensive at-home lab tests, leveraging the acquisition of Trybe Labs, which could enhance service personalization and attract new customers. Additionally, expansion into markets such as Canada and Europe (through the acquisition of Zava) opens new revenue growth opportunities. The company demonstrates continuous financial improvement, including record profitability and a 111% revenue increase since reaching its ATH (All-Time High) in February 2025, which builds investor confidence.
The chart analysis of Hims & Hers Health, Inc. (NYSE: HIMS) indicates a clear upward trend in the recent period. The current price is approximately 49.38 USD. Based on historical data and visible momentum, there is potential for a growth of about 50%, which could bring the price to around 75 USD. Key support is located around 45 USD, while resistance may be tested in the 55-60 USD range before further upward movement. It is recommended to monitor volume and key technical levels to confirm the continuation of the trend.
Potential TP: 75 $
HIMS trade ideas
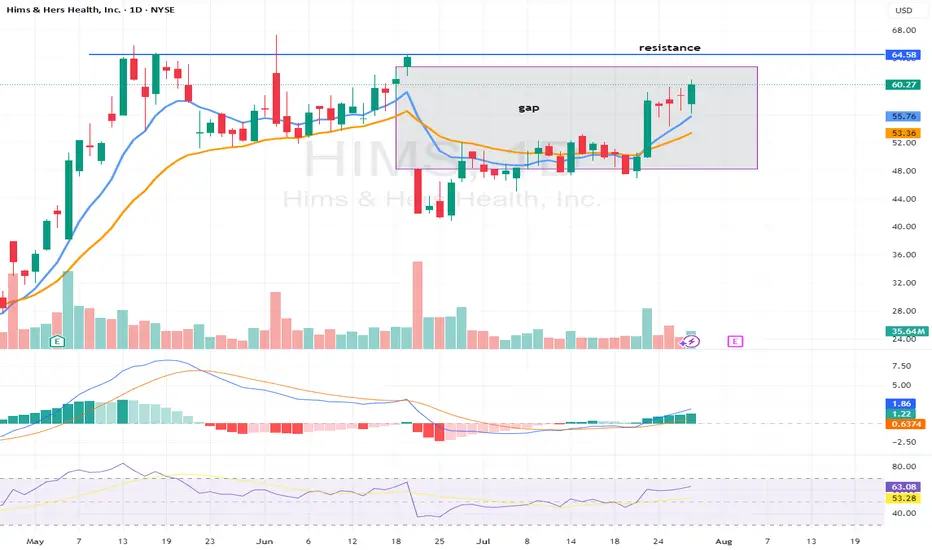
$HIMS - stock going for gap fill plus key resistance level. HIMS - Stock on the way to gap fill to $62.96. calls added in the group. Stock has been failing to hold after breaking $65 level. ON high watch if that level breaks for a move to the upside. Company to report earnings next week. Could see a move towards $65 pre earnings.
HIMS - Wait for it, don't rush itI would wait for the correction to complete around the 45 zone, then start adding when the parallel channel breaks. It has already faked out once. Do not fall for this.

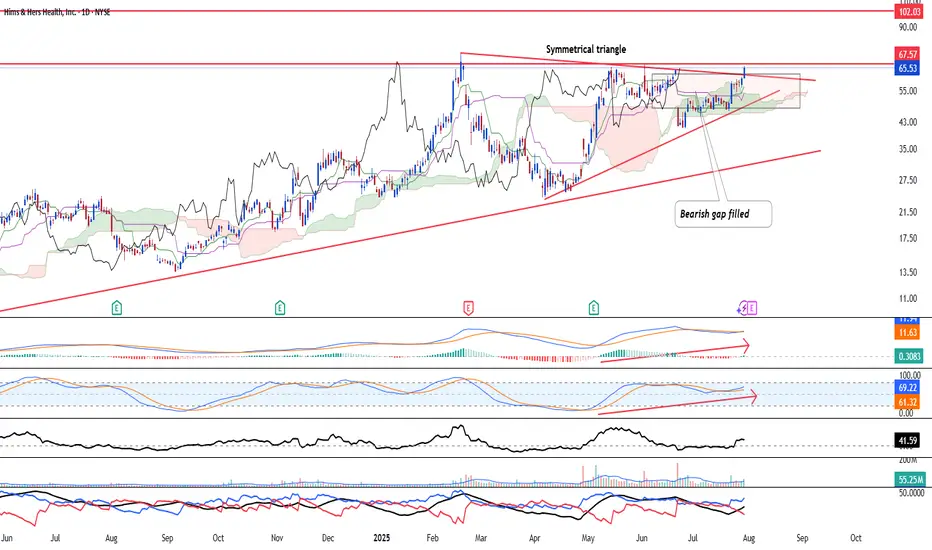
HIMS & HER - Uptrend to continueHIMS & HER NYSE:HIMS is looking at a strong bullish continuation after the stock broke above both the symmetrical triangle and the bearish gap. Resistance at 67.57 has been tested multiple times and is likely to be weakened. Hence, they are likely to break higher.
Furthermore, the stock has shown strong momentum returning after long-term MACD histogram has turned positive and stochastic oscillator crossed above the 50-line and rose, indicating momentum in the mid-term is back in action.
Directional movement index continues to show strong bullish strength.
Strategy:
Buy spot @ 65.53 or buy stop above 67.57. Bull limit @ 49.32 in the event of a correction.
Target 1: 96.93 (1 month est)
Target 2: 110.88 (3-6 month est)
HIMS WEEKLY TRADE IDEA (7/29/25)*
**💊 HIMS WEEKLY TRADE IDEA (7/29/25)**
**🔥 Bullish Flow + Rising RSI + Institutional Volume**
**📈 Trade Setup**
• **Stock**: \ NYSE:HIMS
• **Direction**: CALL (LONG)
• **Strike**: \$64.00
• **Entry**: \$0.92
• **Target**: \$1.38
• **Stop**: \$0.46
• **Size**: 2 contracts
• **Expiry**: Aug 1, 2025 (3DTE)
• **Confidence**: 80%
• **Entry Timing**: Market Open
---
**🧠 Why This Trade?**
✅ **Call/Put Ratio = 1.37** → Bullish sentiment
✅ **RSI Daily: 65.2 / Weekly: 61.3** → Momentum building
✅ **1.8x Weekly Volume Surge** → Institutional accumulation
✅ **\$64C OI = 2,616** → High liquidity + interest
⚠️ **Gamma Risk + Fast Decay** → Time-sensitive play
---
**🎯 Strategy**
→ Play the momentum spike into expiry
→ Exit quickly on profit target or 50% stop
**#OptionsTrading #HIMS #SwingTrade #EarningsPlay #TradingViewSetup #FlowTrade**

HIMS - 3rd times a charm!A really nice company with lots of growth potential, stock is used as playball for scalpers at this moment that turns down many big investors, but the less volatile it gets the more it will pump because it gets more attractive for bigger investors.
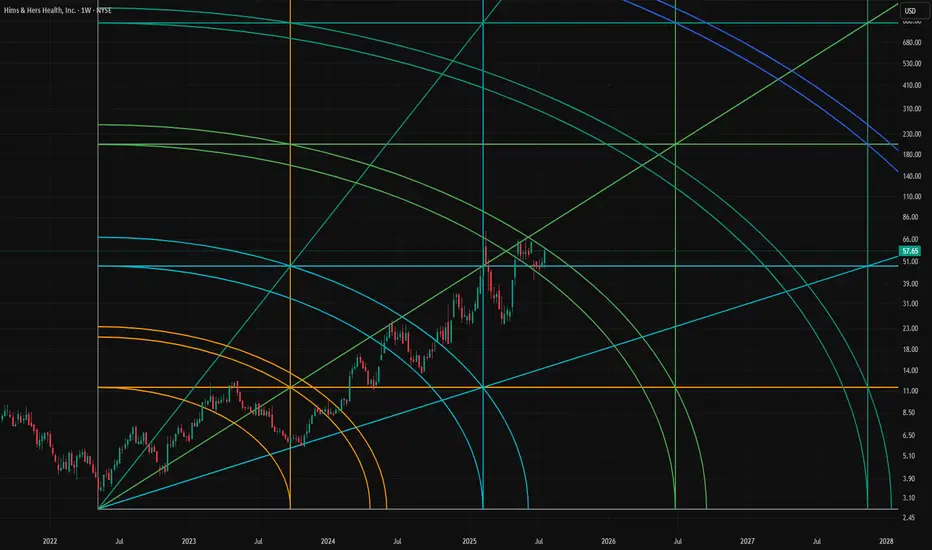
$HIMS gann arc if the arc breaks we gravitate up to the next one. This combined with a cup and handle!
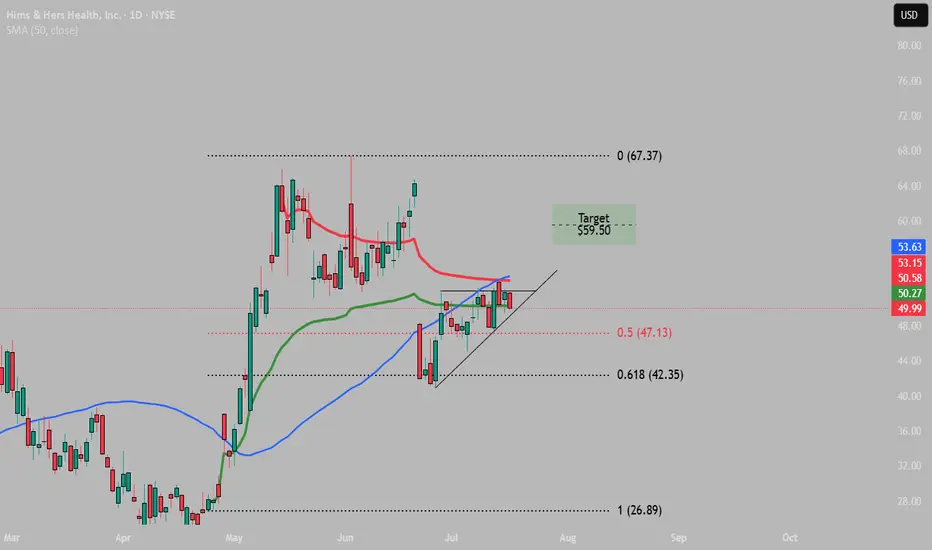
$HIMS Squeeze Time Frame: 1D
RSI : Neutral
MACD: Bullish Cross
Fib Levels: Retraced back to 61.8%
Target:
$59.50
Pattern invalidated of drop below 61.8% ($42.35) Fib level.
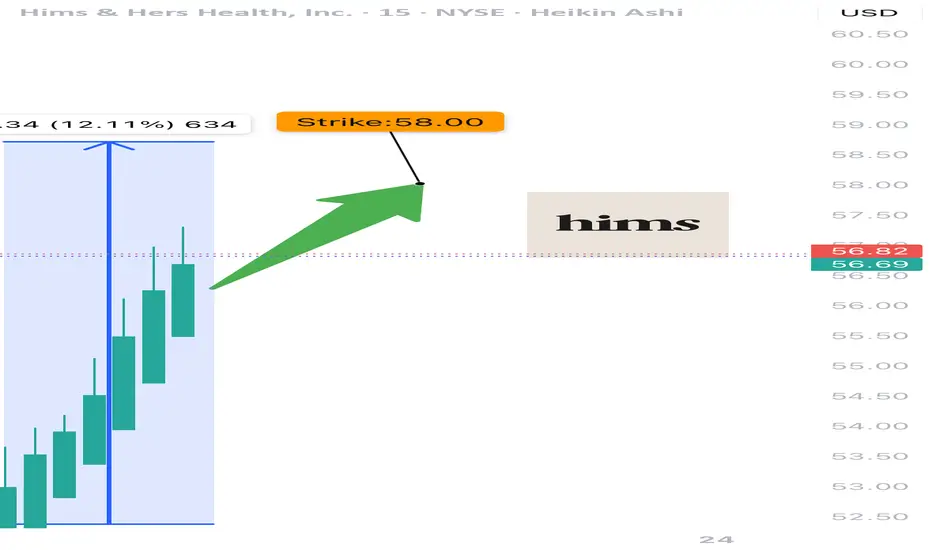
HIMS WEEKLY BULLISH PLAY — 07/23/2025
🩺 HIMS WEEKLY BULLISH PLAY — 07/23/2025
📈 Momentum Up, Flow Bullish, Time Tight — Let’s Ride It
⸻
🔍 MARKET SNAPSHOT
5-model AI consensus = ✅ BULLISH
Why?
• 📈 Weekly RSI = 58.2 (Rising) — Clear momentum
• ⚖️ Call/Put Ratio = 1.63 — Big call volume (45K+)
• 📉 Volume = 0.9x — ⚠️ Slight institutional hesitation
• 🌪️ VIX = 16.0 — Low volatility = smoother execution
⸻
🎯 TRADE IDEA — CALL OPTION PLAY
{
"instrument": "HIMS",
"direction": "CALL",
"strike": 58.00,
"entry_price": 0.86,
"profit_target": 1.72,
"stop_loss": 0.43,
"expiry": "2025-07-25",
"confidence": 75%,
"entry_timing": "Open",
"size": 1 contract
}
⸻
📊 TRADE PLAN
🔹 🔸
🎯 Strike 58 CALL
💵 Entry 0.86
🎯 Profit Target 1.72 (+100%)
🛑 Stop Loss 0.43 (tight risk)
📅 Expiry July 25 (2DTE)
⚡ Confidence 75%
📈 Size Suggestion Risk 2–3% of capital
⚠️ Key Risks Low volume + high gamma exposure
⸻
🧠 MODEL TAKEAWAYS
✅ RSI and momentum are clearly aligned upward
✅ Call flow = bullish commitment
⚠️ Volume is light → watch for momentum stalls
⚠️ Gamma risk = manage tight, exit fast
⸻
💬 Drop a 🧠 if you’re tracking
📈 Drop a 💥 if you’re in this call
🛎️ Trade tight — expiration Friday, HIMS is moving on momentum not mass
#HIMS #OptionsTrading #CallOptions #BullishPlay #MomentumTrade #ZeroDTE #GammaScalp #AITrading #HealthcareStocks
Him Daily chart NYSE:HIMS — daily chart shaping up nicely 👀
If it breaks above $53.39, next target could be $61.57 🚀
Clean setup with ascending support — let’s see if volume steps in!

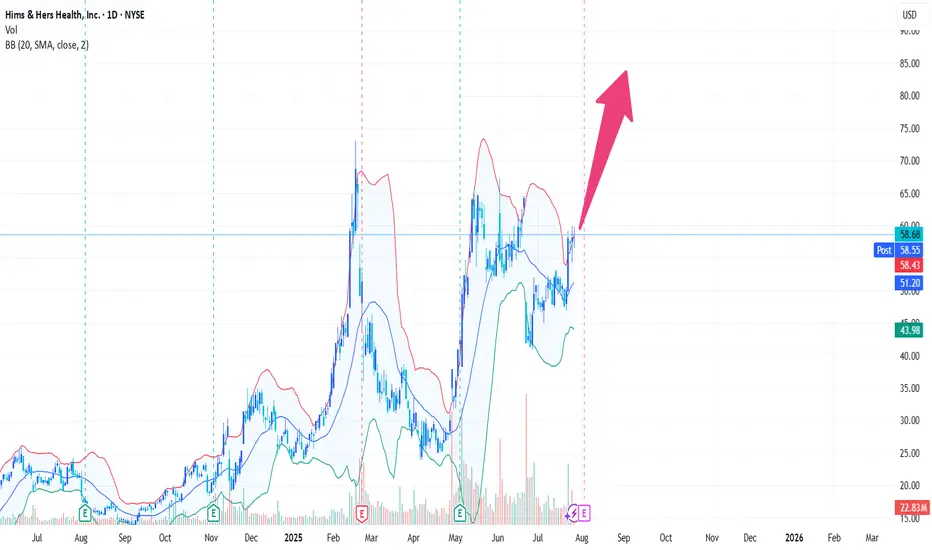
$HIMS $58 mean reversion target on horizonNYSE:HIMS daily with bullish engulfing candle. $58 pt is for gap fill.

$HIMS - ORBCLEAN breakout for NYSE:HIMS today.
DP_ORB Indicator marked it at candle close outside of ORB Zone, with confirmation bias from a higher high, and volume. All take profits were hit!
If you want the DP_ORB Indicator for FREE:

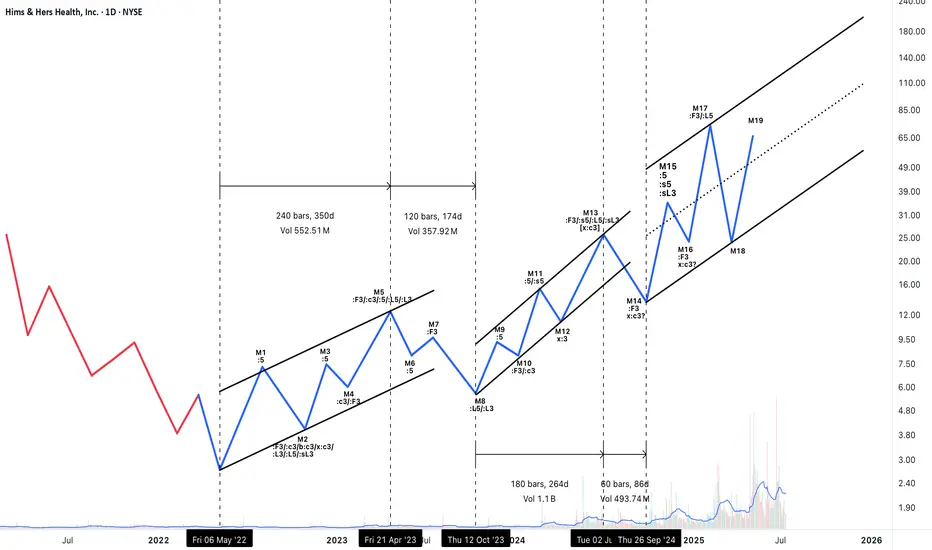
Neowave Structural Outlook – Complex Correction: W–X–Y–X–ZThis analysis interprets the ongoing structure as a Complex Correction in the form of a W–X–Y–X–Z pattern. Here's a breakdown of the logic behind the wave labeling and key observations:
Overall Structural Summary:
W wave (M1–M5): Though M1 is labeled as ":5", a closer examination of its internal structure reveals corrective characteristics. Therefore, the entire M1–M5 segment is best interpreted as a complex corrective structure, possibly a double three or flat.
X wave 1 (M6–M8): A clear Zigzag, fulfilling the requirements for a valid X. All relevant time and price criteria are met, forming a neat connector after W.
Y wave (M9–M13):
M9–M10: A Zigzag formation.
M11–M12–M13: M12 serves as an x-wave, and M13 unfolds as a simple corrective move in three waves, completing the Y wave. Though M13 is a single-leg visually, the internal structure confirms a three-part move.
The Y wave is longer in both time and complexity, appropriate for its position in the sequence.
X wave 2 (M14): Despite appearing as a short single move, it satisfies the X criteria in the context of the ongoing correction. The small size is acceptable as per rule allowances for connectors in Z formations.
Z wave (M15–ongoing):
M15–M17: Another Zigzag, forming the first leg of Z.
M18: Likely the X connector within Z.
M19: Assumed to be the beginning of the final leg of Z. The structure from here forward will determine whether Z completes as a triangle, zigzag, or another combination.
Supporting Rule Applications:
Several Neowave rules were cross-verified:
- Rule 2a and 5a were referenced to validate corrections that exceed the 61.8% retracement and duration benchmarks.
- Rule 7c and 4 supported impulse invalidations and corrections involving running structures.
Time symmetry across connectors and leg duration was considered to maintain wave consistency.
Visual Channels:
All W, Y, and Z legs are progressing within clearly defined channels.
The Z leg is currently within a steep rising channel. If Z completes as a non-triangular formation, a reversal might follow.
Conclusion & Risk Notes:
This structure, though corrective in nature, contains strong upward segments — especially within Z — making it tradable for bullish swings.
Given that Z is the final leg, caution is warranted. Once Z completes (especially if M19 develops into a three-wave structure), the larger correction may terminate, potentially leading to a larger trend reversal.
Position management (e.g., scaling out or using stop-losses) is advised as the structure evolves.
My buy view for Hims & Hers stock. My buy view for Hims & Hers stock.
Overall, I believe this asset is still in a bullish direction. I remember hoping into accummulating this stock when it dropped from $64 to $41 at the open of market on 23/6/2025 which I sold off when it hit $50.
However, I still hold a strong buy bias with my entry and exit showing on my chart (analysis).
Please trade with care as I still look forward to $64 per share for this stock long-term.
Please, kindly like, share your thoughts via comment and follow me for more.

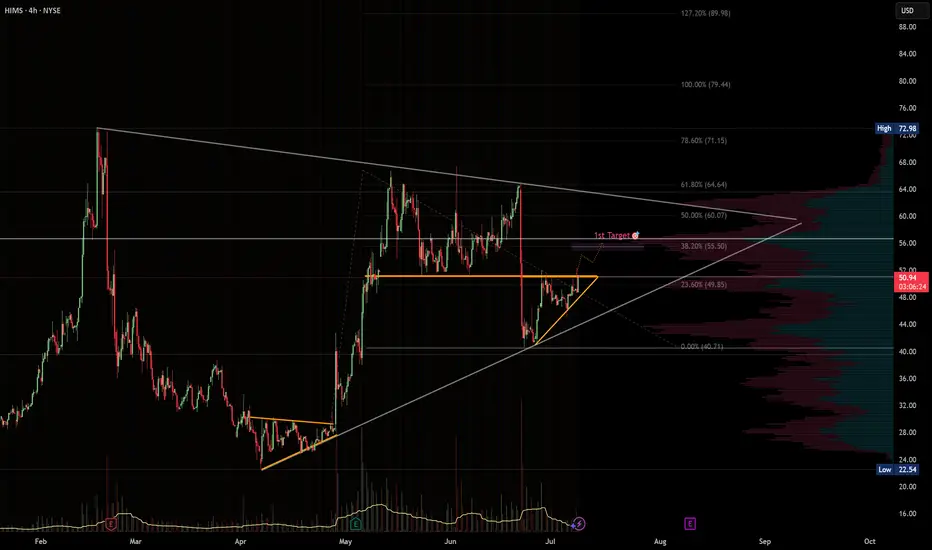
HIMS · 4H — Symmetrical Triangle Breakout Targeting $55 → $60Setup Breakdown
HIMS is forming a symmetrical triangle consolidation, with price tightening between rising support and descending resistance.
The structure follows a previous impulsive move, suggesting this is likely a bullish continuation pattern.
Volume is contracting — typical for pre-breakout setups — and price is holding above a key short-term rising trendline.
A breakout above $52–53 could initiate a fast move into the next resistance band.
---
🎯 Target Zone
🎯 Target Level Reason
Target-1 $55.50 (38.2% Fib) Volume gap fill + first resistance from prior consolidation range. A clean spot for partial profits.
Target-2 $60.00 (50% Fib) Strong historical resistance + Fibonacci confluence. Ideal level to take the rest of the position or trail a runner.
---
🛠️ Trade Plan (Example)
Component Action
Trigger Long on a confirmed breakout above $52 with volume ≥ 20-SMA
Entry Add-on Pullback retest of broken triangle resistance ($52) acting as new support
Stop-loss Close < $49.50 — invalidates the triangle
TP-1 $55.50 — take 50–70% off, move stop to breakeven
TP-2 $60.00 — exit or leave a small runner in case of further breakout
---
⚠️ Risk Notes
Earnings date approaching – trade may need to be closed or hedged before volatility spikes.
Break below $49.50 invalidates the pattern and opens risk to $46 or lower.
Watch for volume confirmation — fakeouts can occur if breakout lacks momentum.
---
✅ Checklist
Triangle structure with strong trendline support
Low-volume zone between $53–60 favors fast expansion
Targets align with Fib + volume profile
Risk clearly defined
Earnings awareness in place
> Disclaimer: This is not financial advice. Trade your own plan and manage risk appropriately.
$HIMS | Cup & Handle Setup FormingA classic cup & handle setup is building on the 4H chart.
Price just broke out of a falling channel (handle), and is now testing a key breakout zone between $48–$53. A daily close above $54–$55 with volume would confirm continuation.
I’ve mapped out three potential price targets ($73.88, $99.17, $145.34) based on the depth of the cup and Fibonacci extensions.
Watching:
RSI trending higher
Bullish trend intact via 8/21 EMA
Sub-$40 = pattern invalidation
Breakout + volume = go time. Watching closely this week.

A Cheeky ScalpLet's see if the Bart pattern moves all the way down, keeping a tight stop loss below the barely holding support
HIMS - Potential Bearish ABCD & FVG Retest Setup (4H)\HIMS is currently showing signs of a potential bearish ABCD pattern forming, with the recent rejection at point A and retracement towards B, holding around the 1.617 Fibonacci extension level. A possible short-term bounce may occur toward point C (0.618 retracement), before continuing downward.
📉 Bearish Scenario:
If C confirms as a lower high, a drop toward the FVG GAP zone between $31.85 and $27.94 becomes highly probable, aligning with the 1.618–1.886 Fib extension.
The volume profile indicates a low-volume node (LVN) around the FVG, making it an attractive magnet for price.
🔍 Key Levels:
Resistance Zone (Red Box): $66–$74 (previous supply and high-volume node)
Support/FVG Target: $31.85 (1.618 ext) / $27.94 (1.886 ext)
POC above: $56.02 – potential pivot level if bulls regain control
⚠️ Watch for:
Reaction at $49.50–$50.00 resistance (0.618 retrace zone)
Volume confirmation on breakdown toward FVG zone

6/25/25 - $hims - How I'm trading this for size6/25/25 :: VROCKSTAR :: NYSE:HIMS
How I'm trading this for size
- i make a lot of moves, as you can tell. but you'll also notice i tend to find positions that i like as i validate the thesis... and go massive
- NYSE:HIMS and NASDAQ:TSLA are two names that i'm not new to, but have been wrangling for some time given valuations really haven't been "cheap" per se. there's a good reason for that.
- so $hims. i reset book last night, and now after seeing this thing to red on the day after opening to a squeeze nearly >5%... i'm back to wranging.
i. want. to. own. this.
it's scarce paper. a scarce CEO. scarce growth. and it's hitting right at the heart of the war on pharma, in it's own "novel" way that just makes me excited to root for the success.
- valuation is not honestly, expensive
- but communication and headlines will drive a lot of price action (as has been the case) now that NVO has unofficially announced that they're losing market share and, frankly, the stock is uninvestable and will ultimately underperform the winner NYSE:HIMS
- SO
- I'd like to make this a 5...10...15% size should oppty allow for it.
- but LEAPS are expensive. I also have my eye on more of a retrace toward mid 30s if we get a garden variety pullback in general risk (go read my S&P issue from last night... i still think we r trucking higher, but am prepared for this garden variety pullback as well). SHOULD THIS HAPPEN, NYSE:HIMS would be a name that probably eats more beta dirt than others given the recent action (i'm thinking from a big money institutional ownership perspective).
- therefore, i'm playing bi weekly ITM calls for size but in a paradoxical way, hoping i lose money on these... so i can grow the duration of my exposure and at a lower strike.
- for now i like the bi weekly $40s ... i'd like to extend this to monthlies should we go lower at a lower strike... and if we do see mid 30s (and i'll be writing about this name if that happens!) i'd attempt to LEAP it out for some big size.
keep me posted if u see anything worth flagging on the name
V

HIMS off to the races to fill the gapNYSE:HIMS is off to the races to fill the upside gap. The NOVO deal that fell thru is an entry opportunity for a strong performer.

Safe Entry Zone HIMS Part-2After the 150%+ profit reached. in part-0
Stock reached blue zone which was part-1 analysis target.
Now Target Reached.
Despite the termination of Novo drugs with HIMs which will hurt HIMS on long run for sure unless they figure out something.
I strongly believe despite negativity and all bad news price subjected to 55%+ run to Red Zone.
STOP LOSS is below Blue Zone. MUST BE.
Price is Volatile at current price level due to Buyers and Sellers Fighting. which is fine.
Note: 1- Potentional of Strong Buying Zone:
We have two scenarios must happen at The Mentioned Zone:
Scenarios One: strong buying volume with reversal Candle.
Scenarios Two: Fake Break-Out of The Buying Zone.
Both indicate buyers stepping in strongly. NEVER Join in unless one showed up.
2- How to Buy Stock:
On 15M TF when Marubozu Candle show up which indicate strong buyers stepping-in.
Buy on 0.5 Fibo Level of the Marubozu Candle, because price will always and always re-test the imbalance.

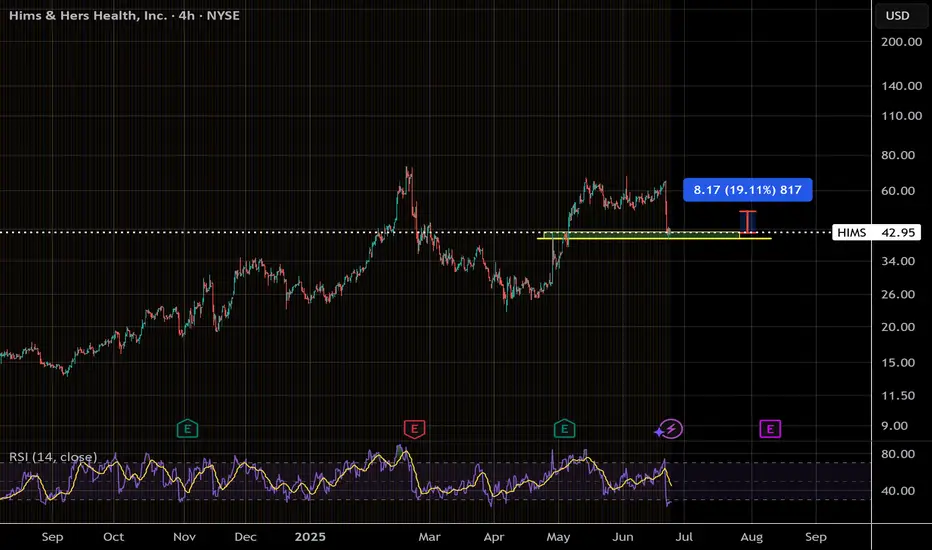
$HIMSNYSE:HIMS is hovering around $45, but demand is drying up.
Buyers seem hesitant at these levels after the hype from the Novo Nordisk breakdown faded.
Without new momentum or a catalyst, we might see a correction or sideways action until confidence returns.

HIMS – Long Setup | Potential 60% MoveHims & Hers (HIMS) just gave us a textbook Ichimoku breakout and is holding strong above the cloud after a healthy pullback.
Technical Breakdown:
Price above Kumo Cloud: Bullish structure intact.
Support held at $54.62 – key base above cloud and Tenkan-sen.
MACD is curling back after a corrective wave, showing early signs of momentum returning.
Risk/Reward: 8.59 – Extremely favorable.
Target: $93.58 (60.22% upside)
Stop: $51.78 (7.01% downside)
Rationale:
HIMS continues to ride bullish sentiment in the healthcare and telemedicine sectors. This chart has a clean continuation setup with institutional buy zones likely around $54-$55. Risk is tightly controlled, and upside potential is significant.
