HOOD bullish reversalHOOD bullish reversal trend starting soon. Expecting it to reclaim support at $24 within the next few weeks if macros align before resuming bullish trend towards $30 into EOY.
HOOD trade ideas

Hood to 24$ soonHood had a pump out of the wedge and then dump like many of these wedges do. A massive pivot has taken place and I took advantage of this by adding to my September calls in the 14$ range. I am starting to sell covered calls against my LEAPs as well. I would love to see the 24$ target as this would be a massive swing trade for me.
-I expect at least 22$ by the first week of Sept preferably 24-25$

Robinhood Stock Rises 2.51% After Record ReportKey Takeaways:
- Robinhood's ( NASDAQ:HOOD ) stock rose 2.51% following its impressive Q2 earnings report, showcasing record earnings and revenue.
- Earnings per share (EPS) increased to $0.21, surpassing expectations, while revenue soared 40% to a record $682 million.
- Significant growth in transaction-based revenue and assets under custody highlights Robinhood's expanding influence in the financial services industry.
Robinhood Markets Inc. ( NASDAQ:HOOD ), the mobile-first brokerage known for revolutionizing retail trading, saw its stock rise by 2.51% following the announcement of its record-breaking Q2 earnings. The report highlights Robinhood's continued growth as a dominant player in the financial services sector, despite ongoing challenges in the broader market.
Record Earnings and Revenue Surpass Expectations
Robinhood's second-quarter performance was a standout, with earnings per share (EPS) climbing to $0.21, an increase of $0.18 from the previous year. This figure easily surpassed analysts' expectations, which had forecasted $0.16 per share. Revenue, too, hit a new high of $682 million, marking a 40% year-over-year increase and exceeding the $640 million anticipated by FactSet.
One of the most impressive aspects of Robinhood's financial performance was the 69% surge in transaction-based revenue, which reached $327 million. This growth was driven by a 43% jump in options revenue and a staggering 161% increase in cryptocurrency revenue. Robinhood's net interest revenue also rose 22%, benefiting from higher securities lending activity and rising short-term interest rates.
User Growth and Asset Expansion
Robinhood's platform continues to attract new users and assets, albeit with some challenges. The company reported a 57% increase in assets under custody, which reached $139.7 billion. Monthly active users (MAUs) grew by 9% to 11.8 million, although this fell short of the 13.45 million predicted by FactSet. Despite the slight miss, the company's average revenue per user (ARPU) rose by 35% to $113, indicating increased engagement and monetization of its user base.
The Robinhood Gold premium subscription service also saw significant growth, with subscribers increasing by 61% to 2 million. This rise reflects the company's success in upselling more advanced trading tools and services to its users, further enhancing its revenue streams.
Net deposits hit a record $13.2 billion, with an impressive annualized growth rate of 41%, showcasing the trust and confidence retail investors continue to place in the platform.
Challenges and Opportunities:
While Robinhood's Q2 performance was impressive, the company faces challenges, particularly in its stock price movement and upcoming ventures. The stock has been in a steep downtrend since mid-July, despite being up 34% for the year through Wednesday. The shares are currently testing support at their 200-day moving average, a critical technical level that could determine their short-term direction.
Looking ahead, Robinhood's entry into futures trading represents a significant opportunity and a potential risk. The company has not yet disclosed its fee structure for futures trading, but the higher costs associated with executing these complex financial products could lead to the introduction of fees. This move might be met with caution by Robinhood’s user base, which has grown accustomed to commission-free trading. J.P. Morgan analysts have suggested that this development could be pivotal in Robinhood's evolution into a full-fledged financial services provider.
Conclusion
Robinhood's strong Q2 results and expanding service offerings is a testament to its growing influence in the financial industry. The company's ability to consistently exceed expectations, both in terms of earnings and revenue, speaks to its robust business model and its appeal to a wide range of retail investors. However, as Robinhood continues to innovate and introduce new products, it must carefully navigate the challenges that come with growth, including maintaining user trust and managing costs. The future looks promising for Robinhood, but the path forward will require strategic planning and execution to sustain its momentum in a competitive market.

$HOOD Head and Shoulders topping pattern after earningsHas a gap to fill quite far down but bears look hungry to take this one down after a great run so far in 2024

What’s under the $HOODFeel bad not buying at $10 what an easy 100%
Stock trading platform for retail investors adding features. Ran hard at IPO, and has now moved up tot eh next fib level and is trying to break through.
Strong consolidation under fib. Looking for a jump at earning.
Target price is hard here. It hasn’t spent much time above $20…… is it possibly it eventually heads back to all time highs in a year? I don’t see why it couldn’t.
I’m looking for the trading platform that incorporates AI suggestions. It won’t be E*trade as E*Trade is garbage.
This is looking like a long. It’s in a great regression channel too….. I like this one.
Not trade advice

Hood wedge updateOnce again, the wedges I track tend to explode outside of the wedge, pump for 2-5 days, then give almost the entire pump back to the market. My plan was a mixture of swing trading and option selling.
-I locked in my August trade for about 50% total
-My September calls remain intact which have a safer strike price for volatility reduction
-I plan to keep my LEAPS and continue to sell safer covered calls against them.
-I think we bounce off 22.3$

40% Increase on the horizonLets keep it simple. We flipped the VAH into support and continue to build value above, next area to test is the VAL above 40% higher. A nice pump is incoming and keep in mind, if the crypto market is bullish so is Robinhood.
Stay focused.
Calculate Your Risk/Reward so you don't lose more than 1% of your account per trade.
Every day the charts provide new information. You have to adjust or get REKT.
Love it or hate it, hit that thumbs up and share your thoughts below!
This is not financial advice. This is for educational purposes only.

Robinhood Robinhood witnessed a strong rebound after forming a higher low at 21.72, to violate the last peak at 24.28, and the confirmation of this breakout by remaining above 24.28, will confirm the current uptrend, triggering further rises near 25.20 - 26.40 - 27.70 - 28.60 on short term.
The stop-loss lies below 22.75$.
the indicators are heading toward the positive side, which confirms the mentioned positive scenario.
The information and publications are not intended to be or constitute any financial, investment, commercial, or other types of advice or recommendations provided.

Hood contractionHOOD contracts leading into Aug 7 earnings. Note the bottoming stochastic RSI. I believe small caps are going to take control here after the recent bullish inflation print. I have a rather large weight bet in my smaller account on HOOD with a complex spread. My target leading into Aug 7 is 25-27$
The Setup (I noted that hood was the slowest to move for my option watchlist last Friday, so I took advantage)
2026 18$ LEAPs for continuous exposure to price action
-These will allow me to sell low delta covered-calls if earnings pumps the price, or I can simply hold these for capital appreciation
8/16 25$ calls (riskiest part of trade)
-These are a cheap way to lever my bet but I have to watch for the 21 theta decay ramp
-The goal with these is to fully exit on a pre-earnings rally, waiting until Aug 7 will cause too much theta decay
9/20 24$ calls
-These allow me to continue potential intrinsic value with the lower strike, less theta decay and more chance to capture rising implied volatility
7/19 and 7/26 22$ cash secured puts
-Since I am so bullish on small caps and hood is so popular I went for high delta premiums, I am fine with getting assigned here but my entries were so good I will likely capture most of the premium on these

HOOD 5 weeks in a row of closes in the $22 rangeHOOD price action getting very tight into earnings. Nice consolidation. Lets see what happens next.

Nothing but airRobinhood IPO'd during a period of dovish monetary policy and high retail speculation. It shortly after giga-nuked as retail speculation wrapped up to find a bottoming range between $6-$12 for a period of 2 years. The volume shelves are actually insane.
Whats next?
Robinhood has broken out in orderly fashion, but has not seen a parabolic rise yet.
A old narrative will likely drive Robinhood into price discovery - Speculation on the return of speculation.
These trends play out faster each macro cycle.
Jun 21 17C

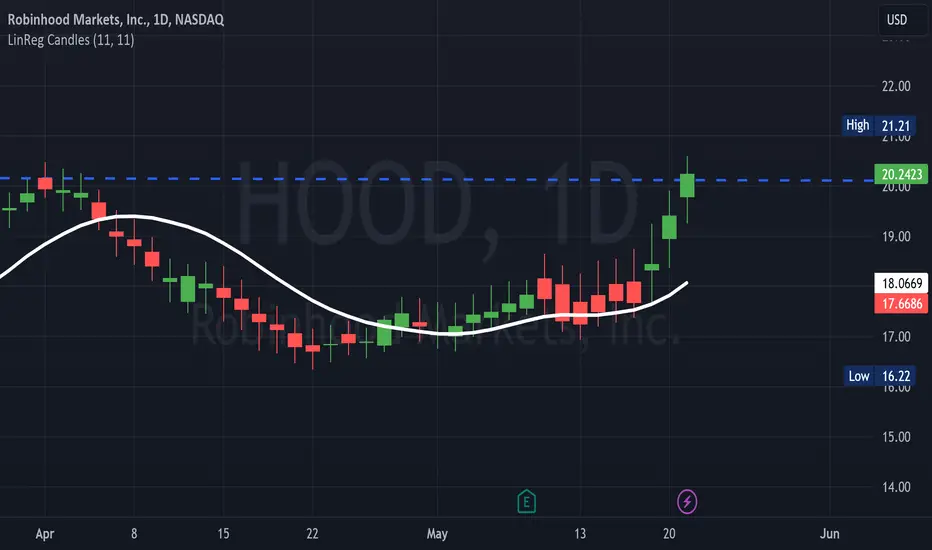
Robinhoodon the daily chart, HOOD witnessed a strong rebound after forming a new higher low at 16.22$, to violate the resistance level at 19.44$, after BofA double upgraded Robinhood (HOOD) to Buy from Underperform. then remaining above 19.44$, will push the stock to test the last major peak at 20.55$, which is the level that needs to be violated, to confirm the major uptrend, which will trigger further rises near 21.70$ - 22.35$ - 23.25$ on the short term.
the indicators are heading towards the positive side, which confirm the mentioned positive scenario

Up-trend stocks: ROBINHOODUp-trend stocks, Break accumulated Phase, Market Structure Shift and Break Market Structure.
Volume Profile shows accumulation as Normal Distribution.
When the price can break up, it is a Buy on breakout and Buy on dip point all the way by framing the trend line channel.
Story Support: Robinhood to acquire crypto exchange Bitstamp in $200M deal.

Multi-Month Consolidation EndingI certainly like this consolidation and chart pattern much more than the company itself but 24/7 trading may help the outlook of what's going on here. Another perceived tailwind may be declining CPI --> more money for retail to spend trading, even though we all know overall USD purchasing power continues to decline regardless of YoY CPI decreases.
Previously, there had been M&A rumors but that seems to have all but died down when SBF/FTX blew up. The DoJ seized 55 million shares of HOOD in January, so something else to keep in mind for this trade.

HOOD: Up Trend & Rising ChannelIn the Chart we can see that HOOD NASDAQ:HOOD
Long term Up Trend.
Rising channel Pattern.
N.B. A small down trend may be seen here.
Resistance : 22.03
Support : 16.48
*If you need more technical or fundamental analysis, you can inform me.

Great Momentum Swing Trade Set UpSetup based on Qullamaggie's style of trading.
Looks like a similar setup is in the works currently but on a smaller scale

Hood Super Performance Candidate RS Rating of 98
Moving Averages Displaying a healthy uptrend
Breaking out of a base after 2 years
I have reasons this security price could increase


This meme stock might have some hype left in itIndicators line up and provide nice confluence with the pinball forecast.

HOODBreakout on HOOD .
Please do your own research, don't just buy/sell stocks from other folks recommendation

ROBINHOOD - Long Term Exponential PotentialROBINHOOD - Long Term Exponential Potential
HOOD as a less favored stock has been bottoming in price for over 2 years....I believe the GameStop saga coming to an end and their rich product suite along with major growth presents a potential exponential opportunity
✅ Exponential Return Opportunity:
The price fell 78% from $85 to $6.81 and since June 2022 has built out a bottoming base making three higher lows in price. Hood has the potential to 5x or 6x from current levels to ATH’s or fall 40% to the all time low. Its small market cap of $9.78B means it can increase in multiples easier than larger brokerage firms such as Charles Schwab (bought TD Ameritrade) and Vanguard Group who are both in the trillions for market capitalization.
✅ Entering New Markets:
At the end of Q3 2023 HOOD entered UK Market offering their brokerage services there. The company is expanding it reach.
✅Aggressive Customer Acquisition Strategy:
There has been a surge in demand for their 3% IRA and old 401k rollover match which offers better interest returns than many of the other large IRA providers in the market. An aggressive marketing campaign has resulted in a 3 week backlog in applications (growing pains). These offerings require people to hold the funds in their IRA's in Robinhood for 5 years, and also be a Robinhood Gold member for 1 year. This will be great for retention of Assets Under Management (AUM) and could result in a sticky customer base.
✅ HOOD Credit Cards are coming:
The CEO has hinted at a release of Credit cards with zero fees to align with HOOD’s mission to democratize finance which may become available in early 2024. Limits may be based on income, not credit score, aiding poor credit access.
✅ Bad Press Dissipating:
Robinhood faced significant consequences for the GameStop scandal, including a fine of $57 million from FINRA and a class action settlement payment of $9.9 million. They have also settled another what appears to be potentially one of the FINAL lawsuits with Massachusetts for $7.5 million (Jan 2024). Some would argue that this closes off the GameStop event, whereby HOOD disabled long entries for GameStop stock to halt a rapidly rising short squeeze. Some people argue that HOOD had no option at the time but to halt trading as this was demanded by Citadel - Robinhood's market-maker partner (whose business would have taken a significant hit if the short squeeze was not averted). You have to wonder though, could this overreach occur again? And you have to wonder if the halt was not put in place could it have led to bankruptcy's which would have impacted a lot more general customers. HOOD is overhauling its digital engagement practices and intends to take steps to increase cybersecurity as part of its legal settlements. I don't agree with what happened however as a trader, with my trader lens on, bad news often presents great buying opportunities.
SUMMARY
The GameStop bad news event appears to be gradually dissipating and given the volume of customers onboarding, the expansion and growth the company is demonstrating, the new products being brought to market and how the chart appears to be basing over 2 years whilst establishing two higher lows, its looking like the bottom may be in. There is an exponential growth opportunity for all the long winded traders out there, strong support of POC and we recently got a bounce off the 200 day moving average on 16th Jan. A long term exponential trading opportunity is there to be had.
Thanks for coming along
PUKA

Robinhood waking up bigtime Macro signs BULLISHHi guys this is a MACRO analysis on Robinhood (HOOD). Macro meaning larger timeframe aka the 1 week in this instance.
Alot of stocks are down from their previous tops. Which means potentials for longterm gains for many names possible.
During the decline of assets, price action may create specific chart patterns that may signal the bottom.
For HOOD -> such a pattern was observed. We've been in this pattern since January 2022.
Making it a BIG DEAL. Acting like a pressure cooker if you will.
This pattern is known as the Rectangle pattern, better known as Consolidation or Consolidation zone.
Remember chart patterns must be traded on confirmation of a breakout. Its never a good idea to buy within chart patterns as experts say within chart patterns its a 50/50 chance. Therefore, probabilities increase once confirmation comes in.
We are currently in the process of trying to breakout.
I am now on full observation mode, as i will be looking to add.
This current move was initiated by a retrace to the golden FIB ratio at around 10.60$. We maintained support, allowing for our current UPTREND.
Notice also i have momentum indicators up.
STOCH RSI has crossed Bullish. This will allow for buying to commence.
MACD is also giving MACRO bullish signs, BULLISH CROSS ABOVE the 0 level and increasing size of the histobars. Major uptrends occur when MACD is crossed bullish above 0 level, you could even say Bull markets occur.
We will continue our Uptrend until Bearish crosses are seen.
Now lets look at the market structure above the consolidation zone. Notice how theres not much data above. Only a single sharp group of candles on the left. This shows no resistance exists above consolidation zone. This means price action above will cut through like butter to my 1st target zone at around $30-35.
NOW REMEMBER watch for confirmation of a breakout atleast on the 1 day but 1 week prefered.
I will be continously updating new information as needed.
__________________________________________________________________________________
Thank you for taking the time to read my analysis. Hope it helped keep you informed. Please do support my ideas by boosting, following me and commenting. Thanks again.
Stay tuned for more updates on HOOD in the near future.
If you have any questions, do reach out. Thank you again.
DISCLAIMER: This is not financial advice, i am not a financial advisor. The thoughts expressed in the posts are my opinion and for educational purposes. Do not use my ideas for the basis of your trading strategy, make sure to work out your own strategy and when trading always spend majority of your time on risk management strategy.
