HUBS has a perfect history of exceeding expectations.HUBS shows a good point of entry here for a stock that beat every quarter since 10 years.
Size accordingly, TP around 40% SL around 20%.
HUBS trade ideas

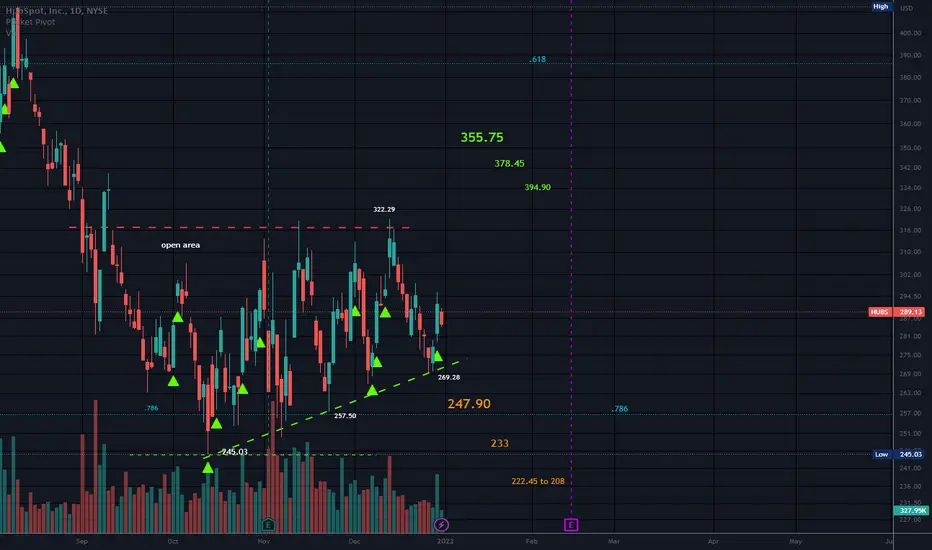
Ascending TriangleThe support line is making higher lows for the time being.
The apex on this triangle has not narrowed much at all so it may last a while like a rectangle does.
The triangle is well filled without a lot of open areas inside.
Earnings estimated to be in February.
Short is around 3.49%.
Neutral until broken.
No recommendation/Looks like analysts are positive on earnings for now and is described as a growth stock.
EPS (FWD)
2.49
PE (FWD)
116.22
Div Rate (TTM)
Yield (TTM)
-Short Interest
3.49%
Market Cap
$14.04B
Last candle pattern was a bearish harami that would need confirmation which would change this to a 3 inside down if confirmation occurs.
I think MR. Market is opening higher on this Tuesday, January 2.
My birthday is closing in and I plan to skip it this year! No more birthdays for me (O:
“The older you get the better you get, unless you are a banana.” — Betty White
"At the age of 20, we don’t care what the world thinks of us; at 30, we worry about what it is thinking of us; at 40, we discover that it wasn’t thinking of us at all.” — John M Eades
HUBS updateI posted the idea yesterday on turkey 101, here is the precise expectations:
- drop to ~353 by mid next week, small bounce then continuation to the 332-340 range to complete wave 4 before August concludes
- wave 5 will be around 438-456 and realized in December
Cool company, among the most volatile names, went from 90 in Mar 2020 because of covid to 860s in 1.5 years - got discounted appropriately (perhaps over-discounted) and now investors have seen what it can do - earnings supported that and reaction was over exuberant, now need to retrace and will get bot up in the 330-350 range in coming weeks. meantime short it

Downside to 340-350 before next leg upPoint target 353 by Aug 17
That will be wave 4, expect bounce from there and wave 5 to 456

Inverse Head and ShouldersPrice is above the neckline of the inverse head and shoulders.
Earnings beat.
Short interest is 5.75%
No recommendation

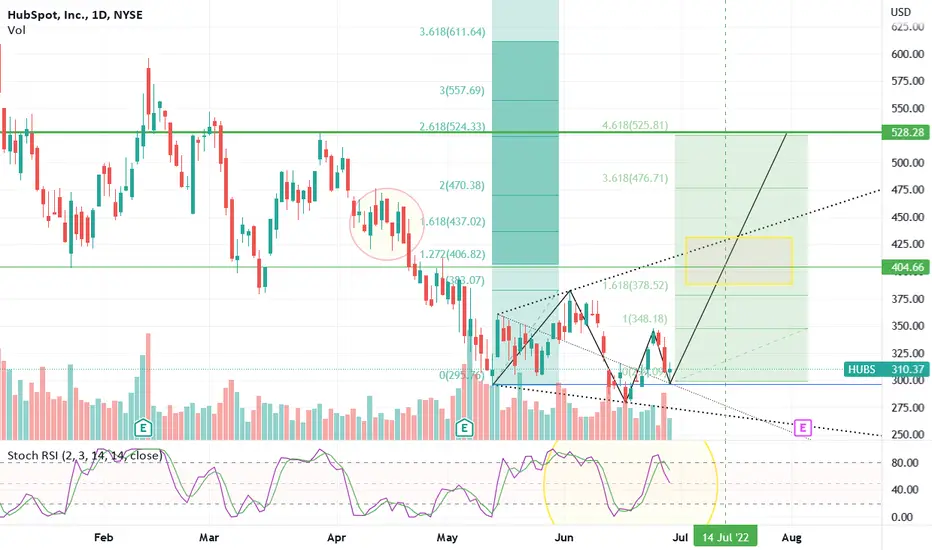
Lift Off could begin 6/30/'22HUBS has my favorite setup. Initial target 404 by Jul 15.
Goal Target 528, can happen faster than you'd expect.
HUBS: Ready to ripHUBS has retraced 76% of the rally since the covid crash. It has finalized its structure perfectly and is ready to rally. First stop is 550

HUBS Long Term Bullish ScenarioI am watching HUBS for a correction to play out in the form of a Wyckoff accumulation and will be waiting for the SOS to get in on the uptrend.

Parabolic ArcWeekly chart.
The average fall is between the.618 (62%) and the .786 (79%)
Arcs often take a breather at the 50% level.
Some fall less and some fall more than these levels.
Volatile on the fall back to earth.
Often the fall is activated when price crosses below the trendline.
No recommendation.
PE 295.63.

Be Safe//ARCParabolic arc. Monthly chart.
Earnings estimated 2-2-22.
Arcs appear as a very steep rise and the upward momentum is impossible to sustain indefinitely. Sometimes an ARC is easier to see on a weekly or monthly chart and curves a bit like an inverted C.
First target is often the 50% mark. The average fall is between 62 to 79% or the .618 to .786 fib levels, but can fall less or more than this. Usually there will be upswings on the way down.
An ARC is volatile on the way down because sentiment can be bullish for quite some time. Panic selling often ensues when people realize what is happening after looking down to the earth and realizing a stock can not go to heaven.
No recommendation


$HUBS Buy the Dip$HUBS HubSpot - Possible dip buy opportunity here at support. Solid company in a strong uptrend for past year+.
Medium term target: $850-$900 range by mid-January
Note: This is NOT investment advice. Educational only.

growth to $920stocks move for a long time in an uptrend. after breaking through resistance, I expect growth to $ 920

Hubspot Inc Hitting $700: Take Profit For +5.5%The pennant pattern worked as expected and the share is now +5.5% (ungeared) since publication this past Monday. Take profit here.

Trade Setup: HubSpot Inc - Pattern PlayThis is a 'higher risk' trade and isn't what you may normally see me propose. Nonetheless, we have a consolidation range that has developed to form a flag pattern. This follows the 'earnings gap' (on volume) on 05-August. The aforementioned consolidation has been on declining volume, suggesting minimal selling into these highs.
Long above $669
Stop: $648
Target: $722
Last Close: $663.66

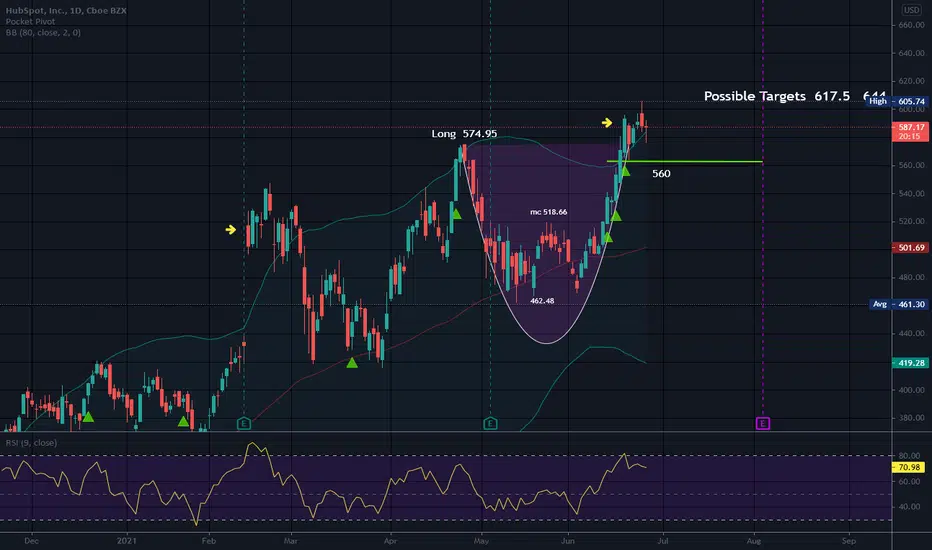
CupNo super great handle but I drew the green line where I see support. You may see it elsewhere. but it does look like HUBS has been on a run. Price is outside the top bollinger band set on 80 which indicates extreme buying pressure. Possible pull back.
The moving averages are all lined up in order and are sloping up.
No recommendation
There is something in the air (o:


HUBSPOT StructureHey traders, HUBSPOT is in a fake bullish move with strong past sell volume and an upside down doji. The TIMEFRAME M1 shows us a marubozu with a fake return of traded sales volume, it leaves towards its lowest filled a bullish breakout gap. With the base of the bolllinger in consideration making its reversal on the top of the bullish channel will be checked without following the bollinger.
And to finish at the top of the comfort zone, there is a strong possibility of breaking out the price with the return of momentum at the same time in the zone. To join the one before and make a new high big chance of direct breakout the top of the bullish channel. Then the comfort zone to fit into yet another with testing from the top of it for a key figure of 490.00 for 498.00.
Please LIKE & FOLLOW, thank you!

Long $HUBSI am seeing a great bullish set up for $HUBS, several reasons, but mainly... stock has consolidated after super powerful mode and had consolidated for more than 2 months. Our algo spotted today there's was a pocket pivot along with TTM_Squeeze. Be aware, earnings are two weeks out, so maybe options trade would be a good option taking advantage of volatility increase prior earnings. 450 or 500 strike price would be a good one, the one thing I do not like is open interest is very low.


