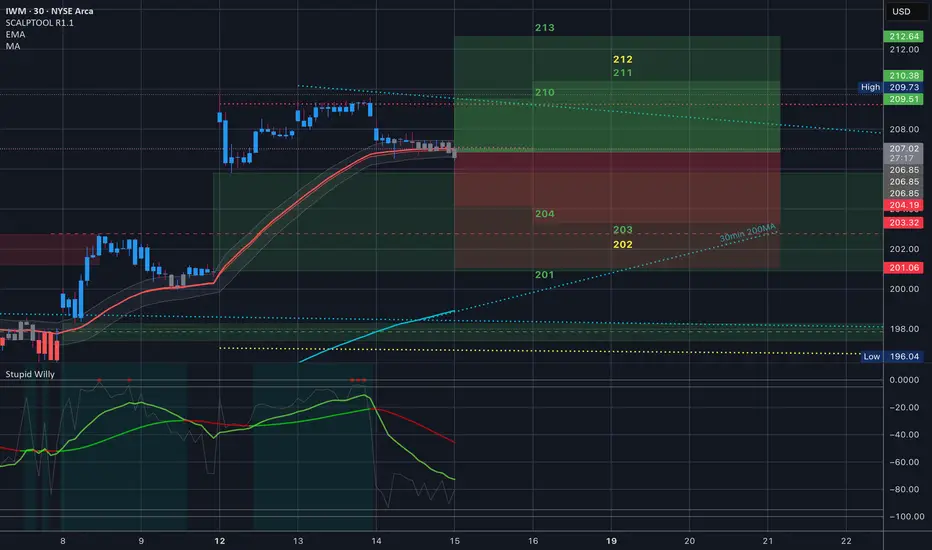
Trend Line in Play - Imminent Advance in Small Caps?Small Caps look the least extended in this equity rally and I really like the tight ranges before it advances to it's next box. My analysis puts IWM imminent on its next advance upwards. Put this trade idea under: "The trend is your friend until it bends".
Key stats
About ISHARES RUSSELL 2000 ETF
Home page
Inception date
May 22, 2000
Structure
Open-Ended Fund
Dividend treatment
Distributes
Distribution tax treatment
Qualified dividends
Income tax type
Capital Gains
Max ST capital gains rate
39.60%
Max LT capital gains rate
20.00%
Primary advisor
BlackRock Fund Advisors
Distributor
BlackRock Investments LLC
IWM is among the best choices in the crowded US small-cap field. The fund tracks the popular Russell 2000 index. IWM's broad basket makes it one of the most diversified funds in the segment. Notably, the fund delves into micro-cap territory, and has often been riskier than our neutral benchmark (as measured by beta) as a consequence. However, including micro-caps is a valid and possibly desirable approach to small-caps, and IWM looks reasonably similar to the benchmark in most other respects.
Classification
What's in the fund
Exposure type
Finance
Health Technology
Stock breakdown by region
Top 10 holdings

$IWM // May 19 2026 // Analysis & Targets for Day TradersAMEX:IWM // May 19 2026 // Analysis & Targets for Day Traders


$IWM // May 16 2026 // Analysis & Targets for Day TradersAMEX:IWM // May 16 2026 // Analysis & Targets for Day Traders
This is for the May 16th contract.
Full Walkthrough on this mornings video

$IWM Analysis, Key Levels & Targets for Day Traders // May 15 25AMEX:IWM Analysis, Key Levels & Targets for Day Traders // May 15 25
Let's go, we had PPI in premarket w// Powell... Today's range looks fun.
IWM INVENTED HEAD N SHOULDER TARGET .786 /alt 618 We have now pulled back in what should be an abc drop The question is as we stop at the 50 % mark I tend to see another advance to the .618 and most likely .786 . I see the bond market decline as ready to turn UP rather big . This should help rally ALL Boats . We also had a nice 5 waves down

IWM: Could Be a Gap Fill Day Today🔍 Posted by WaverVanir International LLC
Looking at IWM on the 15-minute chart, price action remains ambiguous — we’re caught in a range where traditional technical indicators are providing limited directional clarity.
However, our proprietary Decision Support System (DSS) is signaling a potential

Russel 2000 Weekly PotentailVolatility, expressed through standard deviation, quantifies market elasticity and presents a level of probability and precision that humbles us all.
This week with AMEX:IWM you can see that last week trending bi-weekly markets were more volatile than our monthly trending values. This could indic

IWM: Manipulation Accumulation and Trend Let’s see how the market reacts. We may open with a gap down or a gap up—next week will reveal the direction or at least offer a hint of what’s to come.

IWM: Post Market at 206.65 must be a bargaining match. Aftermarket traders joins the party. Any business idea's welcome!

See all ideas
Summarizing what the indicators are suggesting.
Oscillators
Neutral
SellBuy
Strong sellStrong buy
Strong sellSellNeutralBuyStrong buy
Oscillators
Neutral
SellBuy
Strong sellStrong buy
Strong sellSellNeutralBuyStrong buy
Summary
Neutral
SellBuy
Strong sellStrong buy
Strong sellSellNeutralBuyStrong buy
Summary
Neutral
SellBuy
Strong sellStrong buy
Strong sellSellNeutralBuyStrong buy
Summary
Neutral
SellBuy
Strong sellStrong buy
Strong sellSellNeutralBuyStrong buy
Moving Averages
Neutral
SellBuy
Strong sellStrong buy
Strong sellSellNeutralBuyStrong buy
Moving Averages
Neutral
SellBuy
Strong sellStrong buy
Strong sellSellNeutralBuyStrong buy
Displays a symbol's price movements over previous years to identify recurring trends.
Related funds
Frequently Asked Questions
An exchange-traded fund (ETF) is a collection of assets (stocks, bonds, commodities, etc.) that track an underlying index and can be bought on an exchange like individual stocks.
IWM trades at 3,933.68 MXN today, its price has fallen −0.36% in the past 24 hours. Track more dynamics on IWM price chart.
IWM net asset value is 3,929.51 today — it's risen 7.08% over the past month. NAV represents the total value of the fund's assets less liabilities and serves as a gauge of the fund's performance.
IWM assets under management is 1.23 T MXN. AUM is an important metric as it reflects the fund's size and can serve as a gauge of how successful the fund is in attracting investors, which, in its turn, can influence decision-making.
IWM price has risen by 9.43% over the last month, and its yearly performance shows a 13.65% increase. See more dynamics on IWM price chart.
NAV returns, another gauge of an ETF dynamics, have risen by 7.08% over the last month, showed a −11.18% decrease in three-month performance and has increased by 15.12% in a year.
NAV returns, another gauge of an ETF dynamics, have risen by 7.08% over the last month, showed a −11.18% decrease in three-month performance and has increased by 15.12% in a year.
IWM fund flows account for 92.41 B MXN (1 year). Many traders use this metric to get insight into investors' sentiment and evaluate whether it's time to buy or sell the fund.
Since ETFs work like an individual stock, they can be bought and sold on exchanges (e.g. NASDAQ, NYSE, EURONEXT). As it happens with stocks, you need to select a brokerage to access trading. Explore our list of available brokers to find the one to help execute your strategies. Don't forget to do your research before getting to trading. Explore ETFs metrics in our ETF screener to find a reliable opportunity.
IWM invests in stocks. See more details in our Analysis section.
IWM expense ratio is 0.19%. It's an important metric for helping traders understand the fund's operating costs relative to assets and how expensive it would be to hold the fund.
No, IWM isn't leveraged, meaning it doesn't use borrowings or financial derivatives to magnify the performance of the underlying assets or index it follows.
In some ways, ETFs are safe investments, but in a broader sense, they're not safer than any other asset, so it's crucial to analyze a fund before investing. But if your research gives a vague answer, you can always refer to technical analysis.
Today, IWM technical analysis shows the sell rating and its 1-week rating is sell. Since market conditions are prone to changes, it's worth looking a bit further into the future — according to the 1-month rating IWM shows the neutral signal. See more of IWM technicals for a more comprehensive analysis.
Today, IWM technical analysis shows the sell rating and its 1-week rating is sell. Since market conditions are prone to changes, it's worth looking a bit further into the future — according to the 1-month rating IWM shows the neutral signal. See more of IWM technicals for a more comprehensive analysis.
Yes, IWM pays dividends to its holders with the dividend yield of 1.21%.
IWM trades at a premium (0.27%).
Premium/discount to NAV expresses the difference between the ETF’s price and its NAV value. A positive percentage indicates a premium, meaning the ETF trades at a higher price than the calculated NAV. Conversely, a negative percentage indicates a discount, suggesting the ETF trades at a lower price than NAV.
Premium/discount to NAV expresses the difference between the ETF’s price and its NAV value. A positive percentage indicates a premium, meaning the ETF trades at a higher price than the calculated NAV. Conversely, a negative percentage indicates a discount, suggesting the ETF trades at a lower price than NAV.
IWM shares are issued by BlackRock, Inc.
IWM follows the Russell 2000. ETFs usually track some benchmark seeking to replicate its performance and guide asset selection and objectives.
The fund started trading on May 22, 2000.
The fund's management style is passive, meaning it's aiming to replicate the performance of the underlying index by holding assets in the same proportions as the index. The goal is to match the index's returns.