long I like this stock and this is why:
Very long and strong support line.
The stock bouced at it today.
The candle was very strong , opened at his low and close at his high so that shows the strength of the nulls.
After three down days, we are starting to see that bears start to loose control and the bulls are coming in so i think we will see a reversal on the upside because of these reasons.
There is also the MA10 who acted as a support so that brings more srenght for a reversal.
JBLU trade ideas

Jetblue, interesting structure By Joseph Merino:
I think the price is in a critical area, where previously the area has been a support and also a resistance to the price, points: (A C D G I L), if the price falls by the area 19.21 - 18.39, I think a Logical objective would be to go for the target zone 1 indicated in the chart, since the price would fall of a significant support and also lose the Active Bullish trend line indicated in the chart, points: (H J F L)
As for Target zone 2:
I think there is a possibility that the price will find a support in the critical area, then go up to the Zone Target Zone 2, to open long positions from the current level I need the price does not penetrate below the critical area, in addition to The Active Bullish trend line, and would also expect it to break the bearish trend line ( K M) to be more certain that the impulse is bullish.
what do you think?

Long $JBLU, two good support point + bounce on 200 MA, T 22.75$Long $JBLU, two good support point + bounce on 200 MA, T 22.75$


JBLU Bearish Daytrade Played the Gap Bearish. The point of the idea post is to show the succession of Stop placement as the trade moved in my direction. The dotted line is the 200 EMA on the daily chart which is why the stop movements happened more frequently as the trade got closer to that price point.
Trade was setup on the 1 minute chart and then followed on the 5 minute chart. Was stopped out of trade near the end of the day at about 1.5R


JBLU Long: Another Breakout Opportunity!Hey traders, here is another bull flag breakout opportunity. I want to buy after resistance is broken. Happy trading


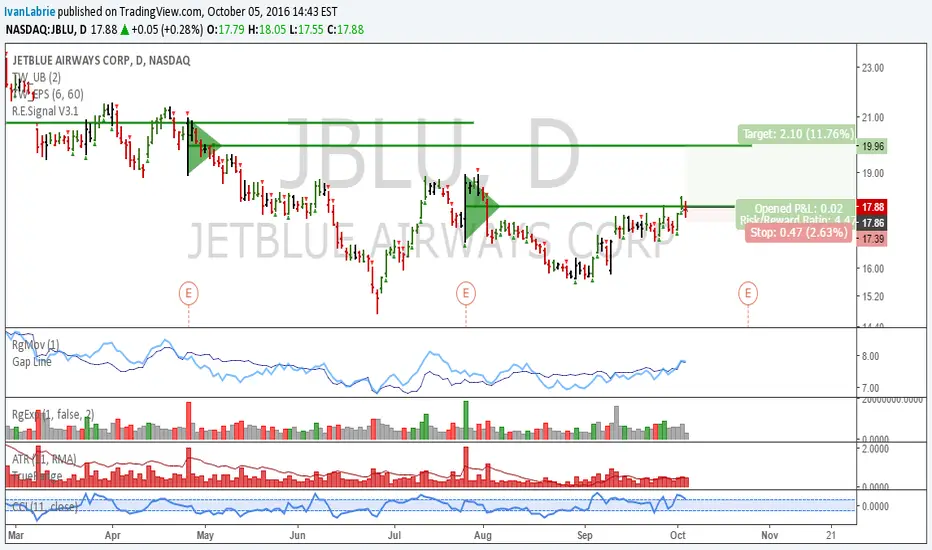
JBLU: Tight stop longWe have a great long opportunity (or a chance if you're long) in JBLU here.
If you follow me and Tim West at the Key Hidden Levels chatroom you'd know we've been buying airlines for a while now, with great results too.
I'm adding to JBLU here, looking to ride the next leg up with minimal risk.
Risking 0.5-1% is ok here.
Good luck!
Ivan Labrie.
JBLU- one of few promising trading opportunities in this marketJBLU- JetBlue is one of the few trading opportunities I see these days. The downtrend seems to be broken and there are two gaps. Today's gap looks good too.

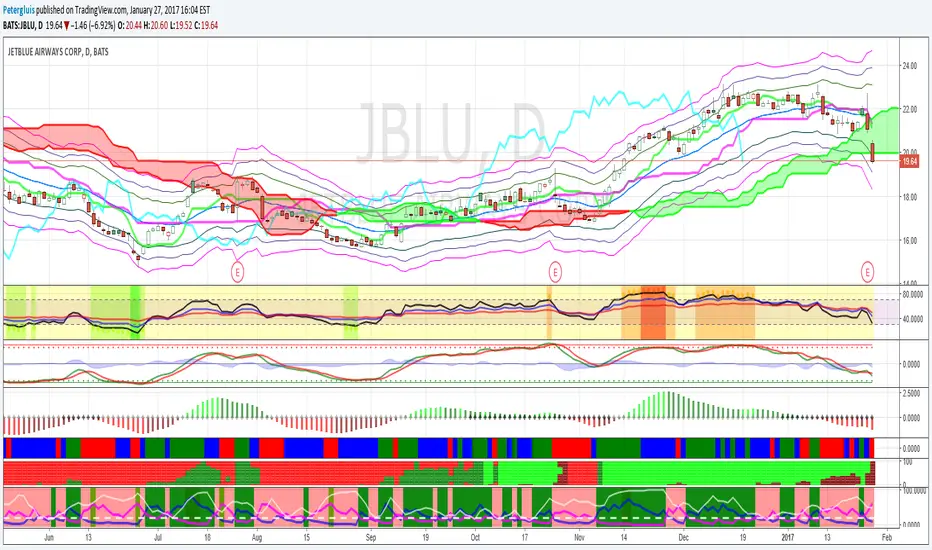
Transports Continue Weak: Trending Now - Jet Blue - LowerI was looking at the transports and I observed mostly non-trending stocks that won't make you money.
Lot's of zig-zags and short moves up and down.
Jet -Blue-is trending. The trend is DOWN.
There are many sell signals.
1. Sell Fractals in effect (rectangle on chart).
2. Alligator jaws opened in tandem with sell Fractal. Now feeding in down-trend.
3. Chop indicator (under chart) (indicates a trend or choppy action) is below the 38.2 shaded area, indicating a trending stock , which is trending DOWN.
4. Phase energy (lower top indicator) is heading lower (two consecutive red bars and the action is BELOW the zero line).
5. Momentum (middle top indicator) is the 5/34 measure, and this is heading sideways to DOWN.
6. Prices are trading BELOW the Ichimoku Cloud .
7. Prices are trading below the thick red Ichimoku Cloud conversion line.
8. Prices are trading below the Ki jun-Sen baseline of the Ichimoku Cloud and this rolling over to the down-side.
9. The trend-line that is heading down (thick golden line just above the sinking Ichimoku Cloud) has been going lower for two years.
I would not own these shares for a long position. I wouldn't buy the-IYT either.
According to the DOW-Theory, the transports have to confirm the-Industrials. I don't think this will happen any time soon.
Good luck to you in all your trades. Don.


Head and Shoulder on JBLU playing outThis head and shoulder on Jetblue is playing out nicely. Target is 11.

Jet Blue / On Downtrend looking for supportJet Blue is on a big downtrend. We are showing some RSI divergence in the last days, but only support on the map is the 16.28 / Fibo 0.682.
Will see how it goes.


JBLU Bullish OpportunityPE = 10.44 ; Forward PE = 8.15 (GOOD)
EP/S (t.t.m) = 1.97 ; EP/S Next Year = 2.52 (GOOD)
Book/sh = 10.04
Target Price $27


JBLU & USDCAD - Long to 26JBLU has shown a strong correlation with USDCAD, as both financial instruments are inversely correlated with oil (shown below). It should also be noted that USDCAD has recently broken out of a cup and handle pattern on the monthly chart and a continued rise could be an early indication of similar price action in the aerospace sector. The wave count for USDCAD suggests that an extended fifth may be in progress, which if true would provide a confluent fifth wave target. JBLU targets may be placed at 26 and 30, extensions of wave ((3)). These extensions proved to be important in sub-degree 5th wave targets and the fractal characteristic of EW suggests that these levels may also play an important role on the larger degree. A SL may be placed below wave (1) high at around 21.40.
Correlation with USDCAD:
USDCAD Monthly Cup and Handle:
USDCAD Wave Count:
