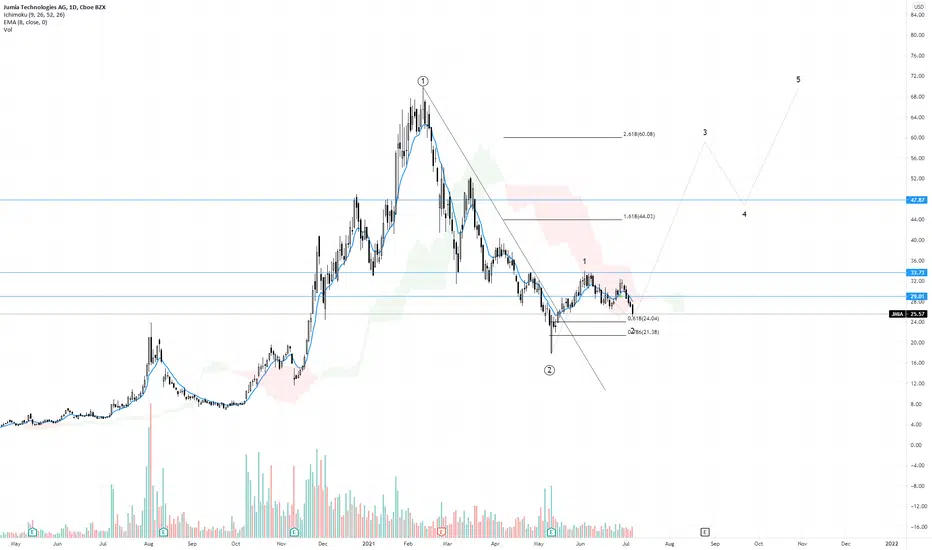
$JMIA Time to WatchJumia is an interesting stock and was a pennystock until they got new management while back. It has recovered, but now it's markcap shows it returning back into a pennystock. At current levels I see an opportunity that you may want to build a position.
News
-Missed on ER, but they have 600mil in cash
TA
-Since I been watching, Jumia has about a 7-8% downside to $17.66 which was resistance back in Aug-Nov 2020. Next point of interest is 28.07 bringing a 45% unside move.
-RSI is oversold leans bullish
-MACD is still bearish and leans more bearish
-Below the EMAs, which is bearish but could have an upside of 7% to try and turn bullish again.
-High vpvr levels at $22 area
Final Thoughts
Overall it's a stock I would buy on speculation, but I'm in ASTR atm so I'll be watching it closely while I look for another trade after I make my gains in ASTR. Jumia has major investors supporting it and its a bet on the African Economy, so maybe do some research on Africa of Covid19 and see how much is being impacted. For myself I don't hear anything about Africa on this matter, so its one piece of news I'm unknown on. Overall I told my friend before it crashed it would hit $50, but now with its MC below $2bil I think its a major steal with a massive upside protentional by years end and maybe the short term.
JMIA/N trade ideas

JMIA - Break through the channel on DivergenceHello everyone,
I hope you are all doing well!
As we may see, we have Divergence while on resistance of the channel that we have formed, which we are most likely going to break.
The Take Profit is sitting at $40.
Have an amazing day!

JMIA MOON COMING?!Earnings out tmr before market opening and the chart looks great so let's see :)
GOODLUCK!

Beaten down JMIA potential reversalJMIA had dipped into the loading zone but, It has also kept itself in a falling wedge. A typical bullish pattern, watch for break forward.


ready for some upside after creating a higher low?JMIA puts had a nice return if you secured! added some shares with profits from puts around 21-22. clearly making a higher low and ready for a little upside. conservative pt of 25 in short term with a bullish market. goodluck ! dont forget to like and follow for more :)

$JMIAGartley harmonic pattern.
4hr classic bullish divergence on the MACD. 4hr RSI is only at 33. Weekly hidden bullish divergence developing on the MACD and RSI too.
Stop = Below support/gap fill
Target = Resistance / C point of harmonic.


Bullish on Jmiajmia is a solid company not really making money yet but again solid as it gets in south africa. stock has been down but i wouldnt say over sold i just think its priced correctly but here we are on the yearly where things get harder for traders because there looking for patterns frrom weeks or months ago and now yearly and i think if we can break out this tim we got some moon juice on jmia !

JMIA downtrend here? be careful longs! hello everyone please leave a like and follow if you enjoy my ideas ! JMIA is entering a bearish downtrend channel on weak volume, all we need is some bad news/earnings and we test TP 2 of 18.5! ill be looking for long entry at 13-16 area. goodluck :)

$JMIA C&H On The WeeklyJumia shares have formed a massive C&H pattern. It is my current belief that the 50% retracement will act as support here and we will see a breakout of this handle in the upcoming months. Also note that today's candle touched to the anchored VWAP from the IPO, which is another bullish sign. Like always, watch out for a break to these levels as a bearish indication. Good Luck!

UpdateWell we dropped to our previous thoughts of where this correction can take this to. We are not done with Wave 2 yet. Let is bleed for few days, until we see some bullish price action.
JMIA Falling Wedge 7/7/21JMIA is setting up for a bullish breakout. Entry on breakout to the upside.
Upside targets are:
$40; $45; $50; $68 (ATH)
Stop loss if it breaks back into wedge following breakout

Current view on JMIA. Relevant levels and structuresToday, we will speak about JMIA.
Let's check the main items we can see on the chart.
a) The price has broken a huge descending Wedge pattern
b) As usual, after the breakout of this type of structure, we can observe a retest or consolidation close to it.
c) In this case, we are observing a consolidation between 34.00 and 27.00. It's possible to observe a new local low on that range or a range between the specified price levels
d) However, the most important level we are observing right now is the activation one. (Green horizontal line at 34.80)
e) If the price reaches it, we expect a continuation of the bullish movement towards the next resistance zone at 48.00
f) Pay attention to the horizontal yellow line as a possible inner resistance zone
g) If the activation level is reached, we expect a resolution between 20 to 40 days
h) Of course that if the price keeps falling, we will cancel our view. Also, if the idea is activated, our invalidation level is below the consolidation structure.
Thanks for reading!

Jumia Technologies: Nearing a Swing LongEarly days but potential change of trend, with descending channel ceasing.
RSI (57) transitioning from neutral to a bullish regime.
Pivot held.
Next: Must get & stay above $32.50 to confirm.
Pre-market: $31.09.
Stop: $27.40.

JMIA Inverse head and shoulders pattern (target: +40%)JMIA Inverse head and shoulders pattern (target: +40%)

Bullish Inverse H&S $JMIA$JMIA has been popping up with heavy bullish call buying and has formed an inverse head and shoulders pattern. Waiting for it to break the neckline with gusto to buy.
A great name to trade, and a great time to go long.

$JMIA Inverse Head and Shoulder formation$JMIA is looking good at recent price rally and forming a nice invert head and shoulder formation. Price target 49.00 which is the depth of the head to shoulder. Right shoulder is forming to level of left shoulder imo.

JMIAWyckoff accumulation on the 2H? Test takes a bit longer than expected, however clear inverse H&S. Above 34 directly more bullish
Amazon of Africa in the making?

Sunday Prep 6/27 - A break over $34 will trigger long playsNYSE:JMIA STRONG STOCKS LOOKING FOR CONTINUATION
From Sunday Prep Jun 27, 2021 prepared by TrueTrader pro @RickyAnalog
---
There is a very strategic reason for having this name on here. If you look at the NASDAQ:TIGR chart (especially the weekly), you’ll see that it has already made the long setup that I anticipated NASDAQ:TIGR could do. We need to break over $34 to really trigger the setup, and at that point I would still want to see pullbacks to support to get long. But I like this chart for an overall swing long.
The weekly chart shows the only thing I DON’T like about this setup
That is the weekly 20sma looming just overhead. But, like I said; I would want this to trigger and then offer better prices later. So that really takes that worry out of the equation. Also, the weekly ALSO shows something that I REALLY love about this chart: Where this pullback came back to. You can clearly see how important this level has been.


WATCHING $JMIA for ENTRY TARGET @ 20.44WATCHING $JMIA for ENTRY TARGET @ 20.44
I’m practicing to nail my entries even better… if target hits I will take a position.
