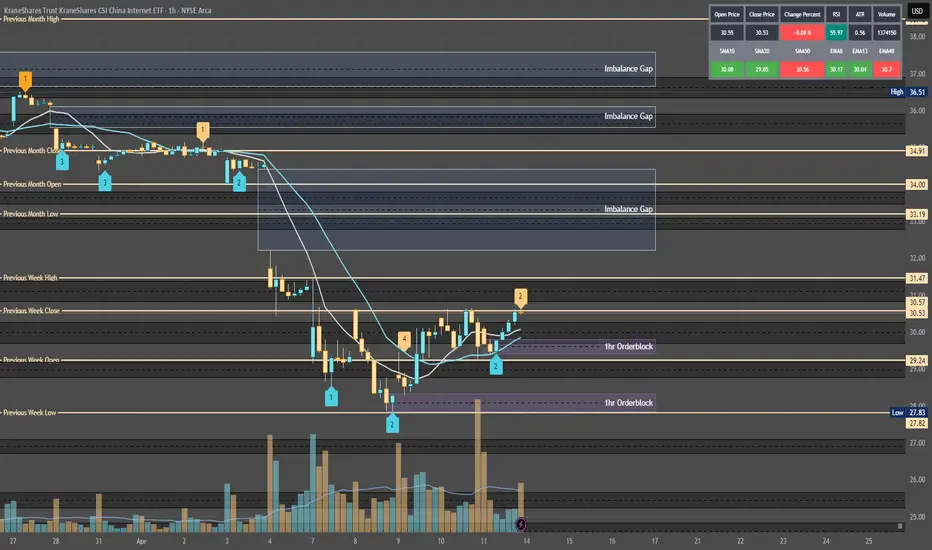
Quantum's KWEB Trading Guide 4/13/25Analysis:
Post-Close Options Activity (April 11):
Data: System reports 469.32K contracts traded on April 11, with puts at 10.99% (calls ~89%). High call volume at $31/$32 strikes suggests bullish bets.
Interpretation: Call-heavy flow indicates retail/institutional optimism, likely targeting a sweep
Key stats
About KRANESHARES CSI CHINA INTERNET ETF
Home page
Inception date
Jul 31, 2013
Structure
Open-Ended Fund
Replication method
Physical
Dividend treatment
Distributes
Distribution tax treatment
Qualified dividends
Income tax type
Capital Gains
Max ST capital gains rate
39.60%
Max LT capital gains rate
20.00%
Primary advisor
Krane Funds Advisors LLC
Distributor
SEI Investments Distribution Co.
KWEB, tracking only overseas-listed Chinese shares of Internet-sector companies, doesn't look much like the broader Chinese IT industry. For one thing, KWEB excludes hardware companies from its selection universe. It only includes Internet software and services, home entertainment software, educational software for home use, retail or commercial services primarily through the Internet, and mobile Internet software and services. KWEB ends up with less Software and IT Exposure than broader funds in the segment and may tilt significantly towards small-caps. Index constituents are ranked by free-float market capitalization in USD and weighted using a 10% capping methodology at each semi-annual rebalance. While not perfectly capturing China's Internet economy, KWEB is a good pure play on Chinese Internet software and service providers.
Classification
What's in the fund
Exposure type
Technology Services
Retail Trade
Stock breakdown by region
Top 10 holdings
Potential KWEB accumulation range breakout36.25 is a key level to watch on a weekly closing basis.
Multiple weekly closes above this will signal a high probability markup campaign.
Long here, stop on weekly close below this high for the accumulation range

KWEB Pivot Point is NearAMEX:KWEB is near a decision point zone.
$37-40.50 are potential resistances.
Above 41 and the sky becomes clearer.

Chinese Internet Stocks on the Edge: KWEB vs. FXI Introduction:
The Chinese internet sector AMEX:KWEB is at a critical juncture when compared to large-cap Chinese stocks AMEX:FXI . The ratio between these two reflects sector leadership—if KWEB outperforms, it signals renewed strength in internet stocks and suggests the sector is leading.
Curre

China’s Internet Revival?KraneShares CSI China Internet ETF is exhibiting strong bullish momentum, with a gap forming around the $27.00 level. A breakout above the $32.60 daily resistance would confirm further strength, positioning the ETF to target $46.19. This trade setup offers an excellent risk-to-reward ratio, with a s

$KWEB - Good RRAMEX:KWEB descending wedge play. Ideal entry below $27 but current level presents a good risk-reward.
With China trades you would need to be ruthless in taking profit.
As always, I share my opinions and trades. I'm not suggesting that anyone follow my trades. You do you.

$KWEB - Would you bet?AMEX:KWEB Trendline has been hard to break. If it manages to break through it, we are looking at a measured move of $35. However, $32 to $33 area would be hard to break through.
It is showing some signs of a potential breakout, but you have to be quick in taking profit. China is hard to bet on.

KWEB BrewingAnother chinese name brewing a great setup
It needs to move quiet a bit before consider an entry, but I have my eyes on this pennat

textbook wycoff bottomspeaks for itself. Should find resistance at the 200WMA.... some consolidation is expected at these levels for a move higher.

$KWEB very bullish for now. Big cap China ETFKWEB montly vs Daily. Very bullish. Hard to get excited about unless they can hold the uptrend for a while.

See all ideas
Summarizing what the indicators are suggesting.
Oscillators
Neutral
SellBuy
Strong sellStrong buy
Strong sellSellNeutralBuyStrong buy
Oscillators
Neutral
SellBuy
Strong sellStrong buy
Strong sellSellNeutralBuyStrong buy
Summary
Neutral
SellBuy
Strong sellStrong buy
Strong sellSellNeutralBuyStrong buy
Summary
Neutral
SellBuy
Strong sellStrong buy
Strong sellSellNeutralBuyStrong buy
Summary
Neutral
SellBuy
Strong sellStrong buy
Strong sellSellNeutralBuyStrong buy
Moving Averages
Neutral
SellBuy
Strong sellStrong buy
Strong sellSellNeutralBuyStrong buy
Moving Averages
Neutral
SellBuy
Strong sellStrong buy
Strong sellSellNeutralBuyStrong buy
Displays a symbol's price movements over previous years to identify recurring trends.
Related funds
Frequently Asked Questions
An exchange-traded fund (ETF) is a collection of assets (stocks, bonds, commodities, etc.) that track an underlying index and can be bought on an exchange like individual stocks.
KWEB trades at 655.70 MXN today, its price has fallen −2.43% in the past 24 hours. Track more dynamics on KWEB price chart.
KWEB net asset value is 658.25 today — it's risen 2.30% over the past month. NAV represents the total value of the fund's assets less liabilities and serves as a gauge of the fund's performance.
KWEB assets under management is 123.73 B MXN. AUM is an important metric as it reflects the fund's size and can serve as a gauge of how successful the fund is in attracting investors, which, in its turn, can influence decision-making.
KWEB price has fallen by −3.84% over the last month, and its yearly performance shows a 23.00% increase. See more dynamics on KWEB price chart.
NAV returns, another gauge of an ETF dynamics, have risen by 2.30% over the last month, showed a −9.80% decrease in three-month performance and has increased by 25.85% in a year.
NAV returns, another gauge of an ETF dynamics, have risen by 2.30% over the last month, showed a −9.80% decrease in three-month performance and has increased by 25.85% in a year.
KWEB fund flows account for 1.04 B MXN (1 year). Many traders use this metric to get insight into investors' sentiment and evaluate whether it's time to buy or sell the fund.
Since ETFs work like an individual stock, they can be bought and sold on exchanges (e.g. NASDAQ, NYSE, EURONEXT). As it happens with stocks, you need to select a brokerage to access trading. Explore our list of available brokers to find the one to help execute your strategies. Don't forget to do your research before getting to trading. Explore ETFs metrics in our ETF screener to find a reliable opportunity.
KWEB invests in stocks. See more details in our Analysis section.
KWEB expense ratio is 0.70%. It's an important metric for helping traders understand the fund's operating costs relative to assets and how expensive it would be to hold the fund.
No, KWEB isn't leveraged, meaning it doesn't use borrowings or financial derivatives to magnify the performance of the underlying assets or index it follows.
In some ways, ETFs are safe investments, but in a broader sense, they're not safer than any other asset, so it's crucial to analyze a fund before investing. But if your research gives a vague answer, you can always refer to technical analysis.
Today, KWEB technical analysis shows the buy rating and its 1-week rating is buy. Since market conditions are prone to changes, it's worth looking a bit further into the future — according to the 1-month rating KWEB shows the buy signal. See more of KWEB technicals for a more comprehensive analysis.
Today, KWEB technical analysis shows the buy rating and its 1-week rating is buy. Since market conditions are prone to changes, it's worth looking a bit further into the future — according to the 1-month rating KWEB shows the buy signal. See more of KWEB technicals for a more comprehensive analysis.
Yes, KWEB pays dividends to its holders with the dividend yield of 2.94%.
KWEB trades at a premium (0.39%).
Premium/discount to NAV expresses the difference between the ETF’s price and its NAV value. A positive percentage indicates a premium, meaning the ETF trades at a higher price than the calculated NAV. Conversely, a negative percentage indicates a discount, suggesting the ETF trades at a lower price than NAV.
Premium/discount to NAV expresses the difference between the ETF’s price and its NAV value. A positive percentage indicates a premium, meaning the ETF trades at a higher price than the calculated NAV. Conversely, a negative percentage indicates a discount, suggesting the ETF trades at a lower price than NAV.
KWEB shares are issued by China International Capital Corp. Ltd.
KWEB follows the CSI Overseas China Internet. ETFs usually track some benchmark seeking to replicate its performance and guide asset selection and objectives.
The fund started trading on Jul 31, 2013.
The fund's management style is passive, meaning it's aiming to replicate the performance of the underlying index by holding assets in the same proportions as the index. The goal is to match the index's returns.