LCID trade ideas

A review on my my Lucid analysis..!More than 50% decline in less than 3 months!
detecting the bullish breakout:
Detecting the Top:
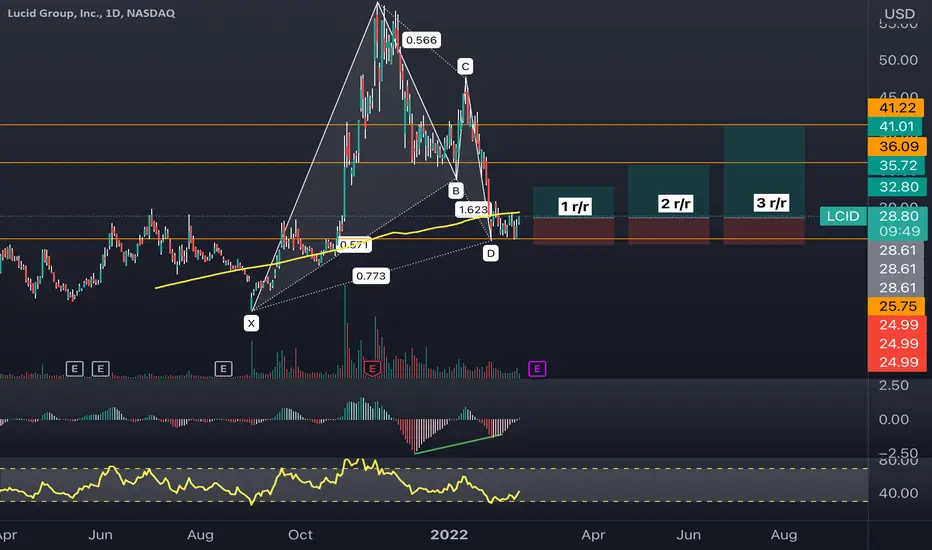
And polishing short analysis:
And target reached:
Do not be fooled by those who promise to take you to the Moon..!
Best,
Dr. Moshkelgosha M.D
DISCLAIMER
I’m not a certified financial planner/advisor, a certified financial analyst, an economist, a CPA, an accountant, or a lawyer. I’m not a finance professional through formal education. The contents on this site are for informational purposes only and do not constitute financial, accounting, or legal advice. I can’t promise that the information shared on my posts is appropriate for you or anyone else. By using this site, you agree to hold me harmless from any ramifications, financial or otherwise, that occur to you as a result of acting on information found on this site.

Earnings watch 2/28 post-marketEarnings watch 2/28 post-market:
LCID
ZM
NVAX
BLNK
WDAY
PUBM
HPE
DDD
SDC
LAZR
Do your own due diligence, your risk is 100% your responsibility. This is for educational and entertainment purposes only. You win some or you learn some. Consider being charitable with some of your profit to help humankind. Good luck and happy trading friends...
*3x lucky 7s of trading*
7pt Trading compass:
Price action, entry/exit
Volume average/direction
Trend, patterns, momentum
Newsworthy current events
Revenue
Earnings
Balance sheet
7 Common mistakes:
+5% portfolio trades, capital risk management
Beware of analyst's motives
Emotions & Opinions
FOMO : bad timing, the market is ruthless, be shrewd
Lack of planning & discipline
Forgetting restraint
Obdurate repetitive errors, no adaptation
7 Important tools:
Trading View app!, Brokerage UI
Accurate indicators & settings
Wide screen monitor/s
Trading log (pencil & graph paper)
Big, organized desk
Reading books, playing chess
Sorted watch-list
Checkout my indicators:
Fibonacci VIP - volume
Fibonacci MA7 - price
pi RSI - trend momentum
TTC - trend channel
AlertiT - notification
tickerTracker - MFI Oscillator
www.tradingview.com


LCID Forecast using GPT method. This is just to track a test going forward.
Prices are calculated from major highs and lows.

HEAD and SHOULDER pattern LCIDI see the head and shoulder pattern formation in the stock. take care and enjoy. Only for educational purposes.

$LCID, Earnings report could push this stock either way The short-term price movement is heavily dependent on the upcoming earnings report, however recent geopolitical events cannot be overlooked either. Even if delivery numbers are met, I don't think we can expect a substantial push to the upside given the uncertain geopolitical climate. On an earnings beat, I would expect the stock to retest the $30 resistance and perhaps flip it to support.
If the delivery numbers come up short, I expect the stock to retest the support at the $16-$17 levels.
Love the company and I'm invested heavily, however, I would take a risk-off approach heading into earnings.

strategy for LCID Thursday 02/24/2022analysis of the strategy: opening below the sell price (23.60) 1# as long as the closing on the daily chart is with a red candle, and the opening opens with a gap, this will be a gap bearish retest, it means this goes up to close the gap, but if at the closing of the gap the volume increases the price does not go down, it goes up.
the same happened with TSLA, ROKU, FB

lucidalthough holding in this descedning triangle this is a bearish pattern. i have seen these setups result in strong breakouts however until we can hold 30-29$ as support, my bets would be on the 21$ area as the launch pad to retest 36$. personally thats where my buy orders would be sitting unless we did push through 30s and hold as support

bearish signs ! 🚩lcid breaking back below extreme resistance, volume decreasing, bearish downtrend channel..
all are pretty bearish signs in my opinion, so I expect a dip to 17-20 area before a potential bottom.
a break back above extreme resistance would be bullish for lcid
like and follow for more! 💘

Lcid trade plan Iv is very high on lcid and they have upcoming earnings so i am probably not going to be playing lcid but i want to put this idea out their to others. This is a very bearish pattern that formed a support at 25.5. there is no clear support under 25.5 so i am looking at the next point at 20 which is a mental support. good luck everyone.

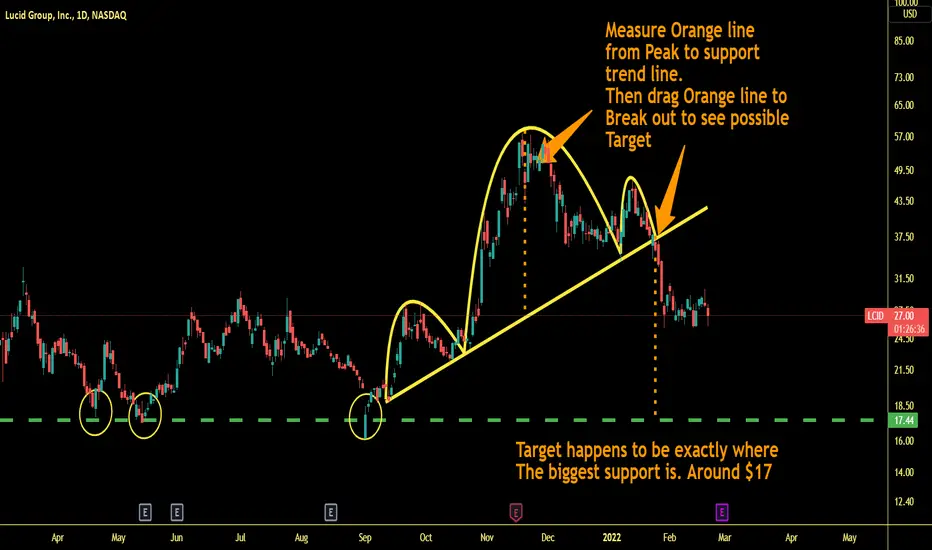
How to Measure Head & Shoulders TargetWhat Is a Head and Shoulders Pattern?
A head and shoulders pattern is a chart formation that appears as a baseline with three peaks, where the outside two are close in height and the middle is highest. In technical analysis, a head and shoulders pattern describes a specific chart formation that predicts a bullish-to-bearish trend reversal.
The head and shoulders pattern is believed to be one of the most reliable trend reversal patterns. It is one of several top patterns that signal, with varying degrees of accuracy, that an upward trend is nearing its end.
The first and third peaks are shoulders, and the second peak forms the head. The line connecting the first and second troughs is called the neckline.
An inverse or reverse head and shoulders pattern is also a reliable indicator that can signal that a downward trend is about to reverse into an upward trend. In this case, the stock's price reaches three consecutive lows, separated by temporary rallies. Of these, the second trough is the lowest (the head) and the first and third are slightly shallower (the shoulders). The final rally after the third dip signals that the bearish trend has reversed and prices are likely to keep rallying upward.
The opposite of a head and shoulders chart is the inverse head and shoulders, also called a head and shoulders bottom. It is inverted with the head and shoulders top used to predict reversals in downtrends. This pattern is identified when the price action of a security meets the following characteristics: The price falls to a trough and then rises; the price falls below the former trough and then rises again; finally, the price falls again but not as far as the second trough. Once the final trough is made, the price heads upward, toward the resistance found near the top of the previous troughs.
Measuring head and shoulders price target is simple.
You'd measure the peak of the head down to the neck line, and then drag it to the point where the stock breaks out from the pattern.
strategy for LCID friday 02/18/2022LCID: sell zone ( 30.11 ) ( 29 80 )
LCID buy zone ( 26.00 ) ( 25.53 )
strategy: we should not chase the price in case the opening is above yesterday's closing price all this is sell zone the bullish entry is (30.20) resistance at (30.80).
bearish entry below (27.80) we can see it in the post market if it is so for tomorrow easy money

LCID TradeStock is in support/buy zone. There is resistance at 35ish. There is also a crossing over of the 100 SMA with 50 SMA meaning there is bearish sentiment.
Right now I would play this by selling put options around the support/resistance line. I would not mind being assigned the shares. The company is legit as it has many of the top exe from tesla and other companies. IF assigned the shares I would begin to sell covered calls on the stock
My own DD - Do your own and use your own intuition. I am not a financial advisor nor is this advice

$LCIDTweezer bottom along horizontal support.
Confirmed Daily MACD classic bullish divergence and RSI classic bullish divergence.
Stop = Below horizontal support.
Target = Resistance
(Needs to get over $29.81 for a real move to take place imo)

LCIDLONG-TERM: Double bottom at support and PCZ of bullish gartley, classic bullish divergence. (not financial advice)
Lucid Group Analysis 14.02.2022Hello Traders,
welcome to this free and educational analysis.
I am going to explain where I think this asset is going to go over the next few days and weeks and where I would look for trading opportunities.
If you have any questions or suggestions which asset I should analyse tomorrow, please leave a comment below.
I will personally reply to every single comment!
If you enjoyed this analysis, I would definitely appreciate it, if you smash that like button and maybe consider following my channel.
Thank you for watching and I will see you tomorrow!

Lucid Group accumulationLucid Group, Inc. is an American electric vehicle manufacturer headquartered in Newark, California. The company was founded in 2007.

Lucid (LCID) under pressure but earnings are due soon $LCIDvolume gap worked out perfectly as we earlier identified. now same problem sub $22. Earnings will need strong guidance to help the stock. Sentiment toward EV names is weakening with every inflation and hawkish comment so will be hard to fight. Short term bounces are always possible but the trend remains negative. supports identified.

LCID FAT SHORT opportunity -Looking for the 25.70 retest Monday looking for a clear break below before we get into puts
-More of a quick trade less of a DT


strategy for LCID friday 02/11/2022LCID: sell zone ( 29.40 ) ( 29.12 ) bullish entry above ( 29.68 )
LCID: bearish entry below (27.72) and support (27.42)

watch for the clear breakout past resistance 🔥lcid trying to use previous resistance as support now, if it can climb back above trend support we should see a rally to 33.04-36.09 in the near future.
like and follow for more 💘
