LULU trade ideas
LULU 📉TechnicalAnalysis: LULU – 15-Min Chart (Short Bias)
On the 15-minute timeframe, LULU is currently forming a series of lower highs and lower lows, confirming a short-term bearish market structure. Price recently broke below a key intraday support zone near $243, which had previously held as a short-term demand area. This breakdown was followed by a weak bullish retracement, suggesting supply is in control.
The retracement failed to reclaim the previous structural break, forming what looks like a bearish continuation flag or supply retest, providing an ideal short entry opportunity.
Price is currently trading below the 50-period EMA, and momentum indicators are showing bearish divergence, with price attempting minor higher wicks while momentum (measured via RSI or MACD) continues to trend downward.
From a Smart Money Concepts (SMC) perspective, the internal structure shifted bearishly after a clear break of structure (BOS). Price is reacting to a prior liquidity sweep above $248 before dropping, showing signs of institutional distribution. That high can now be considered a short-term supply origin, and price continues to respect that imbalance.
🔻 Price Target: $225
The next key HTF (higher-timeframe) inefficiency zone lies near $225, aligning with:
Daily bullish OB that hasn’t been mitigated
Previous strong bounce zone
A potential magnet for resting liquidity
📊 Fundamentals Supporting the Bearish Move
Earnings Outlook & Valuation Concerns: LULU's most recent earnings beat expectations, but guidance was tepid, and margin compression was noted, especially on international expansion and inventory buildup.
Consumer Sentiment Shift: Discretionary spending has weakened post-COVID boom in premium apparel; market is rotating into staples and discount retail.
Technical Selloff in Growth Sector: Broader weakness in growth stocks and high-beta names following hawkish Fed commentary reinforces LULU’s downside risk.
6/16/25 - $lulu - Comment at low $240s6/16/25 :: VROCKSTAR :: NASDAQ:LULU
Comment at low $240s
- see comment from 6/6/25 about why $260 post EPS was "interesting" but not obvious to own ST
- now we're only down a modest ~10% from there, so not much has really changed, except discretionary stocks have further drained. so this is not LULU specific per se, but sector/ factor beta
- when you take LT leases out of the EV of ~29.3 bn as of writing, or about 1.5 bn = you get ~27.8 bn. when you consider PF capex is about 500 mm (ex growth)... you end up with FCF this year of ~1.5 bn. so 1.5/ 27.8 = 5.4%.
- in the current macro where consumer has yet to really trough, or where we get "all clear cut to rates" (which is not my base case - if anything i think rates could stay sticky or even head higher in the ST), this means yield for this type of name post the last EPS comms might have to approach 6-7% all else equal
- the mid teens PE of ~16x is "buy" (again referencing the last note), but in this sort of macro/ environment, 13...14...15x is also reasonable until the mkt can underwrite exactly where the "trough" will be and start to put a more comfortable '26 estimate on the stock (we're not there).
- right now there are only three discretionary names i like in this order: NYSE:ANF > NYSE:YETI > $lulu. i only own NYSE:ANF b/c the FCF yield is nearly 15% on my est. and growth/ mgns also decent/ last EPS was "good". I trade around NYSE:YETI (don't currently own), and i see reason NASDAQ:LULU could get a ST bid here all else equal, so i'm playing a bit of a ST bounce here in the $240 region with some slight ITM option exposure for july.
- however, i'm aware that the low is probably not in
- and i've also seen this stock make nice mean reverting moves before it needs to find a lower level especially b/c the brand is great, the growth is not over... and eventually this will be a top tier discretionary name to own and the mkt is currently pricing it as such, anyway, at mid teens EPS when the rest of the B tier stuff is already single digits. *there's a reason for that*.
- food for thought.
V
LULU Swing Trade Plan – 2025-06-06📉 LULU Swing Trade Plan – 2025-06-06
Bias: Moderately Bearish
Timeframe: 5–10 days
Catalyst: Oversold momentum, heavy put OI, technical downtrend
Trade Type: Single-leg put option
🧠 Model Summary Table
Model Direction Strike Entry Price Targets Stop Confidence
Grok Moderately Bearish $240 PUT $0.75 +50% < $235 stock 72%
Claude Moderately Bullish $280 CALL $2.74 +45–100% –50% premium 75%
Llama Moderately Bearish $260 PUT $4.40 +50% ($6.60) $2.00 75%
Gemini Strongly Bearish $240 PUT $0.75 +100–200% $0.37 75%
DeepSeek Moderately Bullish $300 CALL $0.64 +100–200% $0.32 75%
✅ Consensus: Oversold with strong bearish trend
⚠️ Disagreement: Some models expect a bounce; others expect continued capitulation
📉 Technical & Sentiment Summary
Trend: Strong multi-timeframe bearish (price below all major EMAs)
RSI: Deeply oversold across charts
MACD: Bearish with early signs of momentum fading
Sentiment: Heavy put OI at $240/$260, falling VIX, some speculative reversal interest
Max Pain: $300 (well above current)
✅ Final Trade Setup
Parameter Value
Instrument LULU
Direction PUT (SHORT)
Strike $260
Expiry 2025-06-20
Entry Price $4.40
Profit Target $6.60 (≈+50%)
Stop Loss $2.20 (≈–50%)
Size 1 contract
Entry Timing At market open
Confidence 75%
💡 Rationale: Balanced premium vs. downside exposure, fits current trend and offers high R/R around near-the-money strike
⚠️ Key Risks & Considerations
Oversold RSI: May cause short-lived relief rally
Macro Reversal: Broader risk-on rally or LULU-specific positive catalyst could invalidate trade
Theta Decay: Accelerates next week → use time-based stop if trend fades
6/6/25 - $lulu - Buy $260s, but not "need" to own6/6/25 :: VROCKSTAR :: NASDAQ:LULU
Buy $260s, but not "need" to own
- stock is objectively a buy here in the $260s, let's get that out of the way
- but when it comes to "what can happen next" or "what's the floor/drawdown", i think a few considerations
- flat EPS guide in '25 is not bc of structural issues w brand, so high teens PE esp on '26 #s is reasonable and FCF supports in mid to high 4s on '26 ests.
- the main fly in the ointment is obviously the US consumer and recession issues (second would be tariffs and ability to take price - which they talked on conf call - into this "weaker" consumer)
- ultimately i'd expect the stock to recover a bit here into the high $200s... perhaps $280 such macro doesn't fall to pieces immediately, but will be hard to see stock recover $300 soon.
- i also tend to think the lows could be tested if we get a risk off moment sooner vs. later
- and this isn't a "need to own" in my book at the moment, esp while i'm packing high conviction on obtc, nxt, gamb, tsm and starting to wrangle tsla as of y'day.
- so let's see.
- i won't get *too* greedy. i'm tempted here.
tldr
- but my target is probably in the sub $250 level to start biting and building position
be well my friends, have a good weekend!
V
LULU Earnings Setup – Undervalued Deep OTM Put Play?🧘♀️ LULU Earnings Setup – Undervalued Deep OTM Put Play? 💣
📅 Earnings: June 5, 2025 (AMC) | ⏳ Expiry: June 6, 2025 (1D)
🎯 Strategy: Low-premium put for “sell-the-news” drop after extended rally
🔍 Multi-Model Analyst Summary
Model Bias Strike Premium Confidence Comment
Grok/xAI Moderately Bullish 335C 14.45 65% IV high, but calls rich
Claude Moderately Bearish 330P 12.75 65% Max pain gravity
Llama Moderately Bullish 340C×2 12.15 80% Above key MAs, peers strong
Gemini Moderately Bearish 302.5P 3.15 65% Heavy put OI at $325
DeepSeek Moderately Bearish 285P 0.88 65% Unusual put volume at $285
📊 Technical & Sentiment Highlights
IV Rank: 0.68 → High risk of IV crush post-earnings
Expected Move: ±8.49% (~$28.45)
Max Pain: $325 – indicates potential pullback/pin scenario
Key Risk Factors: Governance flags, mixed sector sentiment, peer strength offsets margin concerns
Liquidity Check: $285 put OI = 2,725; volume = 2,088 → ✅ tradable
🎯 Trade Setup – Earnings Put Play
Instrument: LULU
Direction: PUT (SHORT)
Strike: $285.00
Expiry: 2025-06-06 (Friday)
Entry Price: $0.88
Profit Target: $1.00 (≈13.6% gain)
Stop Loss: $0.25 (≈71.5% of premium)
Size: 1 contract
Entry Timing: End of day 6/5 (pre_earnings_close)
Confidence Level: 70%
⚠️ Risk Management Notes
💥 Requires big move (~15.3% drop to break even)
⏳ 1-day expiry = fast theta burn – quick exit post-earnings
🎢 IV Crush: Even a small move might not offset premium decay
🧾 Audit-related risk: News drop or weak guidance could trigger panic selling
🧠 Rationale
After a strong run-up into earnings and elevated IV levels, LULU is vulnerable to a "sell-the-news" event. The $285 put is deep OTM but has strong volume and fits within the low-risk, high-reward zone. Risk is capped, and reward could exceed 100%+ with a strong bearish move.
Lululemon Looks Poised for Upside Ahead of EarningsTargets:
- T1 = $326.75
- T2 = $345.50
Stop Levels:
- S1 = $312.50
- S2 = $308.00
**Wisdom of Professional Traders:**
This analysis synthesizes insights from thousands of professional traders and market experts, leveraging collective intelligence to identify high-probability trade setups. The wisdom of crowds principle suggests that aggregated market perspectives from experienced professionals often outperform individual forecasts, reducing cognitive biases and highlighting consensus opportunities in Lululemon.
**Key Insights:**
Lululemon is a top contender in the premium athletic apparel sector, supported by strong brand loyalty, impressive consumer demand, and margin stability. Its consistent focus on innovation, international expansion, and diversification of product offerings establishes a strong foundation for growth. Next week's earnings could serve as a major catalyst, with particular attention on the company's ability to navigate inflationary pressures and drive profitability. Technical analysis suggests an actionable long position given proximity to strong support levels and upside in price targets.
**Recent Performance:**
Lululemon has maintained robust growth, outperforming many peers in the discretionary retail sector. Despite broader macroeconomic uncertainties, high-income consumers continue to spend on premium products, positively affecting Lululemon's revenue streams. The company's international arm, particularly operations in China, remains a key driver for future growth.
**Expert Analysis:**
Analysts are optimistic ahead of earnings, citing strong consumer demand, improved inventory management, and effective product diversification strategies. International markets like China are expected to offer significant long-term upside. Concerns persist around inflationary impacts on production and currency-related headwinds, but strong management practices could mitigate these risks. The focus will also be on footwear sales and revenue from new product lines during the earnings call.
**News Impact:**
Lululemon’s earnings report next week is expected to offer deeper insights into its growth strategy amid economic challenges. Expansion in lucrative markets like China and innovation in product categories (e.g., footwear) will likely dominate investor conversations. Any updates related to operational challenges or successes could prompt swift price action. Investors should also watch for commentary on margin trends and promotional pricing strategies.
**Trading Recommendation:**
Given strong fundamentals, favorable technical setups, and high investor optimism, traders should consider a bullish position on Lululemon before its earnings report. Price targets suggest upside potential for momentum-driven traders, while stop levels provide risk mitigation in case market conditions worsen during critical periods.
LULU watch $268: Double Golden fibs to end bounce or Bottom IN? LULU bounced a bit into a tight confluence of Golden's.
Golden Genesis at $267.70 and Golden Covid at $268.74.
These mark a major landmark in the lifetime of any asset.
Rejection here would point to lower lows.
Break and Retest would be long entry signal.
Likely is an "orbit" of these before any move.
===================================================
.
Opening (IRA): LULU April 17th 300/310/390/400 Iron Condor... for a 3.39 credit.
Comments: Delta neutral earnings announcement IV contraction play.
Metrics:
Buying Power Effect: 6.61
Max Profit: 3.39
ROC at Max: 51.3%
50% Max: 1.70
ROC at 50% Max: 25.6%
Will generally look to take profit at 50% max ... .
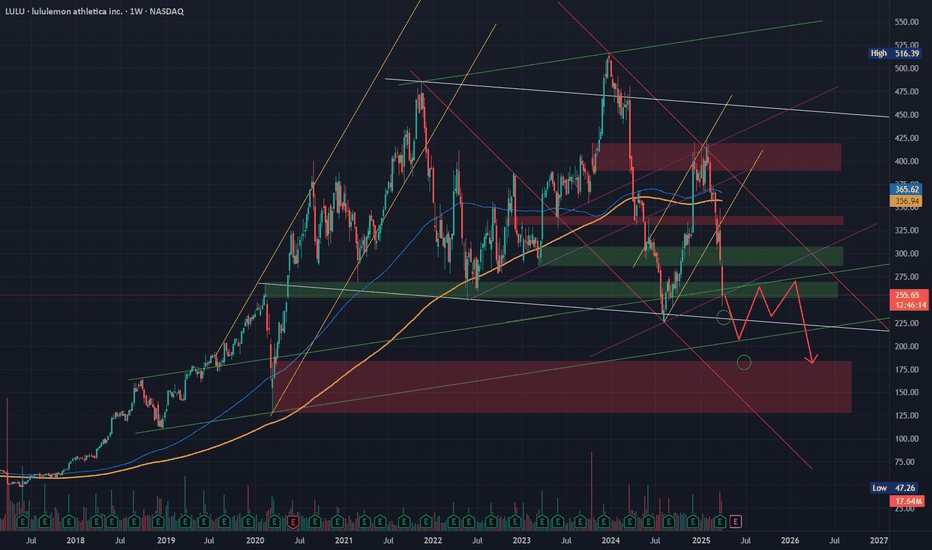
LULU - Tough Road Ahead - What to look out forTough month and outlook for LULU after recent earnings and macro-economic outlook. I'm looking to see a few things play out prior to re-entering a position here - For now, looking for clear bearish liquidity builds to short toward green buying and looking for a subsequent drop from there toward HTF demand at $185
Keep in mind the white tapered selling algorithm at $131 which could be an important hold if HTF price wants to prove a bullish story
Happy Trading :)
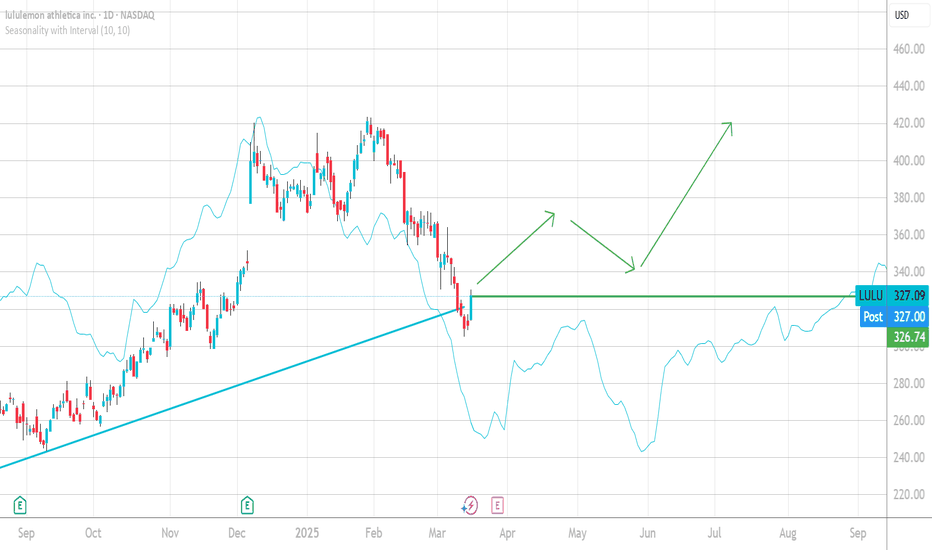
LULU / Lululemon Buy ScenarioMy guts and the seasonality over 10 years of past data suggest that it is a good idea to long LULU. Today is a strong up-day after an inside bar that gives you good calculation for risk management.
let s soo how this goes!
This is not a trade call.... all on your own risk. Trade what you know, understand and see not what people tell you...
leave a like or comment!
Cheers!
Breaking: Lululemon Shares Dip 12.80% In Friday's Premarket lululemon athletica inc., (NASDAQ: NASDAQ:LULU ) together with its subsidiaries, designs, distributes, and retails technical athletic apparel, footwear, and accessories for women and men under the lululemon brand in the United States, Canada, Mexico, China Mainland, Hong Kong, Taiwan, Macau, and internationally saw it's shares tanked nearly 15% in Friday's premarket trading after reporting earnings and revenue beats for its fourth-quarter earnings on Thursday.
Lululemon beat Wall Street expectations for fiscal fourth-quarter earnings and revenue, but issued 2025 guidance that disappointed analysts.
On an Thursday earnings call, CEO Calvin McDonald said the athleticwear company conducted a survey earlier this month that found that consumers are spending less due to economic and inflation concerns, resulting in lower U.S. traffic at Lululemon and industry peers.
McDonald said. “There continues to be considerable uncertainty driven by macro and geopolitical circumstances. That being said, we remain focused on what we can control.”
In light of that, Shares of the apparel company fell more than 10% in extended trading on Thursday and extended the loss to premarket session dipping 12.80%.
Here’s how the company did compared with what Wall Street was expecting for the quarter ended Feb. 2, based on a survey of analysts by LSEG:
Earnings per share: $6.14 vs. $5.85 expected
Revenue: $3.61 billion vs. $3.57 billion expected
Fourth-quarter revenue rose from $3.21 billion during the same period in 2023. Full-year 2024 revenue came in at $10.59 billion, up from $9.62 billion in 2023.
Lululemon’s fiscal 2024 contained 53 weeks, one week longer than its fiscal 2023. Excluding the 53rd week, fourth-quarter and full-year revenue both rose 8% year over year for 2024.
Lululemon expects first-quarter revenue to total $2.34 billion to $2.36 billion, while Wall Street analysts were expecting $2.39 billion, according to LSEG. The retailer anticipates it will post full-year fiscal 2025 revenue of $11.15 billion to $11.30 billion, compared to the analyst consensus estimate of $11.31 billion.
For the first quarter, the company expects to post earnings per share in the range of $2.53 to $2.58, missing Wall Street’s expectation of $2.72, according to LSEG. Full-year earnings per share guidance came in at $14.95 to $15.15 per share, while analysts anticipated $15.31.
Technically, shares of Lululemon ( NASDAQ:LULU ) will form a gap down pattern which is a bearish scenario should market session open. However, the RSI at 59 is strong enough to hold the bears in the 23.6% Fibonacci retracement point a level serving as support point for NASDAQ:LULU should selling pressure increase.
Analyst Forecast
According to 27 analysts, the average rating for LULU stock is "Buy." The 12-month stock price forecast is $394.19, which is an increase of 15.42% from the latest price.
LULU Lululemon Athletica Options Ahead of EarningsIf you haven`t bought LULU before the previous rally:
Now analyzing the options chain and the chart patterns of LULU Lululemon Athletica prior to the earnings report this week,
I would consider purchasing the 337.5usd strike price Calls with
an expiration date of 2025-4-17,
for a premium of approximately $20.75.
If these options prove to be profitable prior to the earnings release, I would sell at least half of them.
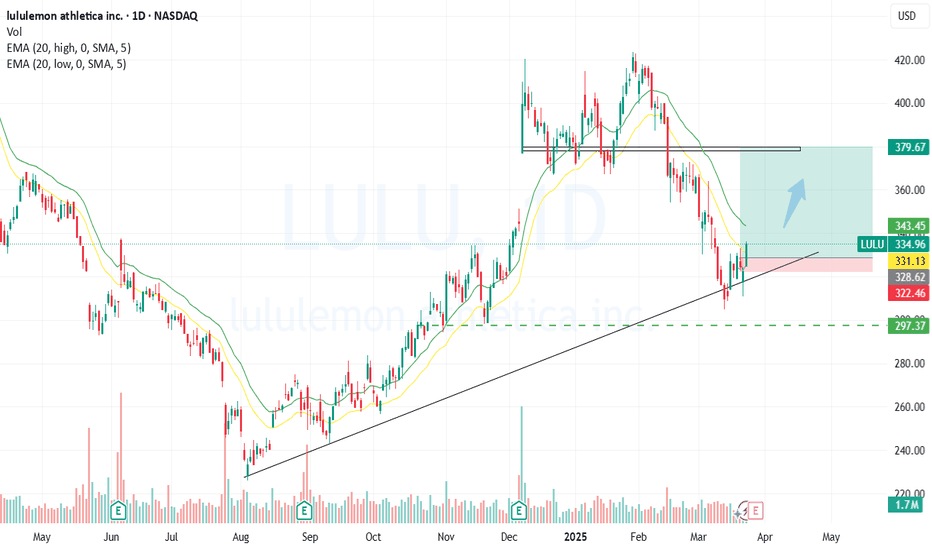
Lululemon's Leap!Lululemon Athletica Inc. (LULU) is exhibiting potential bullish momentum, with a daily gap around the $310 level. A breakout above the $367.15 level could signal further strength, positioning the stock to target the $485.83 resistance. This trade setup offers an attractive risk-to-reward ratio, with a stop-loss set at $296.43 to manage downside risk.
The Relative Strength Index (RSI) for LULU was at 31.86 on March 9, 2025, indicating oversold conditions and a potential for a bounce.
Analyst sentiment remains positive, with a consensus rating of "Overweight" among 36 analysts. The average 12-month price target is $405.03, indicating a potential upside from the current price of $337.35.
This combination of technical indicators and positive analyst sentiment supports a bullish outlook for LULU, with a potential move toward the $485.83 resistance level.
LULU - Updated analysis in a rough marketMarket wide we are seeing massive dips on big names - and obviously the same here for LULU. I am posting this updated analysis while on vacation (apologies for the bad sound and mouse work as I am working on the fly) because I know many are following my analysis on this name and I'd love for everyone to keep an eye on the macro point of view which is always important when we're in a choppy and especially a bearish macro market.
Levels I identified here are all aiming toward us reaching for that $270 demand zone which would ideally bring us some much needed buying momentum heading into earnings. I would not be surprised if we dip there even with a good earnings report considering market-wide we're seeing bearish pressure and people are waiting for opportunities at lower levels to start building a stronger position in companies like LULU.
Happy Trading all :)


