$LULU out of its long term monthly channel$LULU has run up with the recent overall market run up. It has now gone out and over its long term monthly chart. It should either just trend here or pull back to its long term channel.
LULU trade ideas

LULULEMON ($LULU) 👖 | Is Becky's portfolio about to take a dip?📊🧐 Analysts have low expectations for Lululemon earnings this quarter, but the chart and other factors (like its expansion into international markets) point to high hopes moving forward.
In the chart, we take a look at some levels for LULU and compare its strength to the S&P (White) to show how recent weakness and divergence from the broader market's uptrend could result in us eventually retesting support before making another attempt at highs.
Support.
The S1 orderblock is the target for LULU bulls if we see a correction for LULU instead of an immediate uptrend. Despite potential outlooks for future quarters, the COVID quarter earnings are unlikely to instill greed, so a correction may just be in order from that perspective alone. Below that we have the S2 and S3 bullish S/R flips, both of which could act support if S1 doesn't hold.
Resistance.
R1 is the main resistance on the chart. The R1 range highs aside, the current range may also end up acting as resistance if we do move down to S1 or lower.
Summary.
The bull case for LULU still makes sense. However, it'll take a really great outlook and perhaps an earnings beat to have the market disregard what is likely to be an underwhelming earnings report and push LULU to new highs. Given the short term weakness on the chart and expected weakness in earnings, the bulls will probably want to focus effort on defending support rather than trying to FOMO into earnings.
Resources: www.earningswhispers.com + www.barrons.com + www.modernretail.co
✨Drop a comment asking for an update, we do NEW setups every day! ✨
Like, Comment & Follow to help the community grow 🎉🎉


$LULU WILL IT MAKE OR BREAK ?$LULU, has been on a fantastic roll. It been going sky high for a while now. Reports are due soon, will people face the behemoth with good fortune into the future ?
Or feel it deserves to go to the depths of hell ?
What do you think ? Leave a comment below ! And please leave a like to support my content, Thanks !

lulu is severly overbought we can see this name sliced throught the 1.27 retrace fib like butter. on a normal circumstances that should of at least act as resistance but the market didnt care and it kept going up even at severely overbought levels. now its touching the 1.41 retracement about 323 and it got rejected. we dont know if this name will keep going up the the next fib level since the market is completly detached from reality. it is not of my interest to call the top , but twe cant denie what we are seeing. if you want to lower risk, wait for it to fall bellow the 50d moving average to go short. make sure you use stop loss, and buy long date puts because the market its too dangerous to trade even at extremely overbought levels. good luck

LULU Impulse Almost Complete, Corrective wave323 Price Range will be that ATH lulu hits before facing a retrace.
The price levels to eye for taking profit on this retrace are $286 and $263, depending on how aggressive you are.


OK Yoga Pants - I may short you. $LULU"BUY +1 1/2 BACKRATIO LULU 100 (Weeklys) 2 JUL 20 315/290 PUT @.05 LMT" - BP reduction $2500 with $50 Debit
Is a starting point. If you cannot construct this spread and know what your risk is. DO NOT GET IN.

LULU A Nice Short Here IMOMy opinion only.
Short LULU - Thesis of the idea is that it's run up $80+ pts the month of May. Rebalancing should see plenty of institutions selling beginning of June if not late today. Earnings on June 9th should also be underwhelming. ($100+ yoga pants with the amount of unemployment we have?)
Not investment advice.
LULU

LULU Weekly Trend at ResistanceRSI/price divergence and weekly trend at resistance, should be a good short opportunity. I'll be looking for $230-240 puts exp mid to late July.

BUY to LULULEMON ATHLETICA DailyHey people, **DISCLAIMER** content on this analysis is subject to change at any time without notice, and is provided for the sole purpose of assisting traders to make independent investment decisions. LULULEMON ATHLETICA is protected by a solid support wait to see how it vvs to break this one ...
Please LIKE & FOLLOW, thank you!


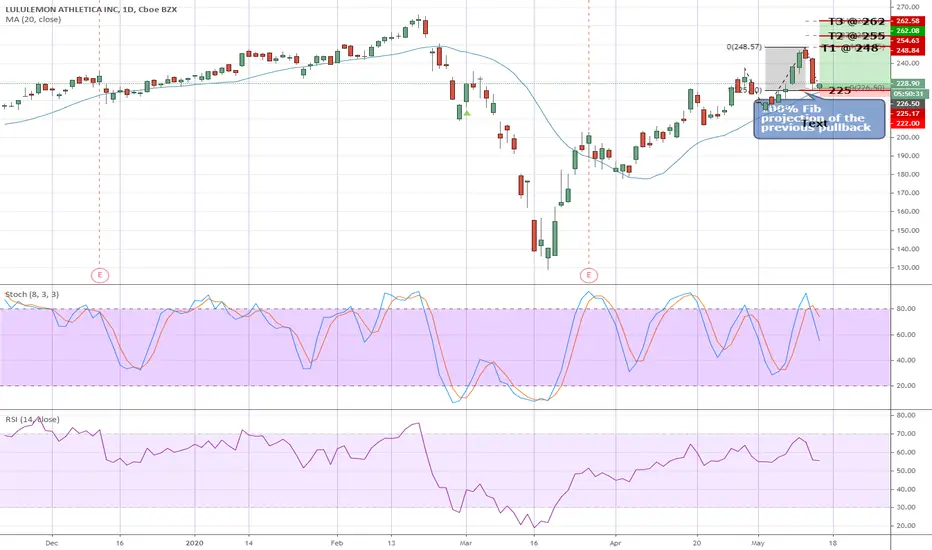
LULU - time to stakeLULU pulled back to 225 which is the 100% projection of the previous correction. Time to long @ 225+/- with a stop at 233 and looking to scale out at $248, $255 and $262 (100%, 121% and 168% fib extension respectively).
Disclaimer: This is just my own analysis and opinion for discussion and is not a trade advice. Kindly do your own due diligence and trade according to your own risk tolerance. Thank you.

LULUAnother one I'm watching today. LULU is just hanging out chopping up and down trying to figure out where to go. For this one, falling out from a previous wedge, my bias is to the upside ... eventually. Either 1) if we go to demand, I'd like to look for an entry long because generally after price breaks down from a wedge pattern, price action tends to retrace and backtest the wedge, with the wedge acting as resistance. Or 2) if we go straight back up to back test, just so happens that the back test area is in alignment with a supply zone.
So, eventually I see LULU making its way back up to back test. If we go to demand zone below, I'll enter a small long with price target up to the supply zone. If we go up first to supply zone and back test, I'll watch as there is potential to re-enter the channel and go trough supply. My bias is to short once price enters supply.


LULUWill watch LULU tomorrow and see what kind of action happens. Think if it holds this demand it currently is in, which aligns with .32 fib retrace, possibly a good opportunity to grab some calls for the upside for wave “c.”
If current demand fails, will wait for it to drift down to next level demand. If gaps up in the overnight, like this market seemingly likes to do both up and down, will see what price does if it shoots to the upside price target / supply zone around the $215 area.

LULU Breakout 186-193
LULU test support/resistance range 186-193 for 4 trading days.
YOY sales growth
Great Earning Result
Strong fundamentals
Good Product
If the stock can complete confirmation of breakout in the next trading days, its up for a run @ 196
Still cover your loss at 181.71 if market goes down due to Corona Virus.
Disclaimer:
This is just my idea as I want to share and learn from the community.
Please let me know your thought

LULU - H&S short setup LULU - Short alerted at 192.43 on Friday. Stop loss 196.53, Target 172.13. Target 2 163.66 Target 3 141.23.Earnings were fine but they failed to provide an update for guidance. What does that tell you! if i was long i would be selling , i am short so i will be holding. Holding $195 May puts. Still a possible trade using same options. Would look to take some profits on the way down.

Head and Shoulder on Hourly - Target 172 , Stop 197.54Taking profits on short position from yesterday and loading up on second trade.
