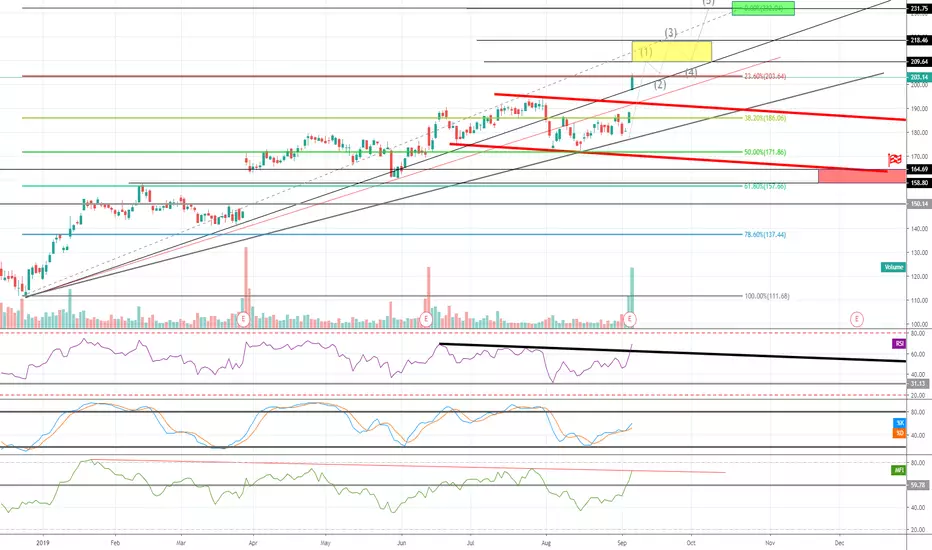
Long $LULU Targeting 209-218-230 as Earning beats estimates As expected earlier if earning will beats estimates by good percentage then $LULU will break up targeting new all time highs , now projected at 230 and next resistance are 209-218-230 Support will be red color channel. The expected scenario is to jump to 230 then drop to 158-168 during end of this year or begin of 2020 as flag sign located then it will be good opportunity for long-term long positions .. we can see RSI break up and MFI still on line Monday will confirm .
Noted some recommendation from many analysis as Lululemon has been on an absolute tear this year and looks poised to continue their tremendous run. The company has benefited heavily from their recent investments in store openings, and these new experience-type stores that offer a variety of services are part of Lululemon’s growth strategy to expand into new categories, like personal care.
LULU trade ideas
Lulu Setting up for High Volatility playLulu beating earnings will gap it up into a supply zone from back in August. Looking at the OIC ivolatility chart, IV sitting at 50% while historic around 30%. Last time 2x when seen these levels the IV has dropped pretty hard. With indexes looking to catch up with EMAs and possible friday selloff, This could be a great set up for Call Credit Spreads here. Set it up and let time do the work for you. Im def looking to jump into this one!

Three Percent Trade Idea: Go long LULUHere is a great opportunity to pick up Lululemon Athletica .
At Three Percent Trades we have a price target of $216.00 / share, which is a potential upside of 16.9%.
We use a combination of fundamentals & technical analysis to trade high probability set-ups, and believe this is a great opportunity to take advantage.

$LULU ON EARNING UP TO 190 THEN DROP TO 170 BEARISH PATTERNIndicators showing positive direction for earning day as expected to announce better than expectations results but we can see weakness on RSI indicators suggested that LULU share will face resistance near by 190 and could be drop from there to below 170 as bearish trend for long term.. IF earning exceeds expectation by big amount and shares get higher than 194.5 then it will be turned to be long uptrend targeting new all time highs ..


LULU's head and shouldersLULU appears to have a H&S going, probably gonna bounce when the daily RSI goes oversold, just in time for earnings.
No position, just looking at it to see where retail sector might bounce. Might be a good long play the week before earnings to get that oversold/pre-earnings pop.
I've made too much money going long on this stock to short it, plus there are crappier companies to short like UAA.

LULU's High P/E has to matter in tiles of uncertainty. 2019 has been amazing for LULU investors but clearly some money is been taken off the table, indicators have weakened considerable and in particular momentum which has taken a nosedive.
In times of such market turmoil a consumer goods company with a 47 P/E is not the place to be, despite the growth. Global uncertainty will have a impact on consumer spending and LULU may be one company that suffers as its products are in the higher price bracket.
AVERAGE ANALYSTS PRICE TARGET $197
AVERAGE ANALYSTS RECOMMENDATION overweight
P/E RATIO 47
SHORT INTEREST 3.4%
COMPANY PROFILE
lululemon athletica, Inc. engages in the designing, distributing and retail of athletic apparel and accessories. It company operates through the following business segments: Company-Operated Stores, Direct to Consumer. The Company-Operated Stores segment comprises of lululemon and ivivva brands; and specialize in athletic wear for female youth. The Direct to Consumer segment is involved in e-commerce business. The company was founded by Dennis J. Wilson in 1998 and is headquartered in Vancouver, Canada.
$LULUPerfect retrace and bounce from golden ratio/weekly trendline support. Waiting now for gap fill (retrace), which is also .5 retrace of current wave up.


Lululemon Still Going Strong (LULU)Stock is once again pushing toward new highs.
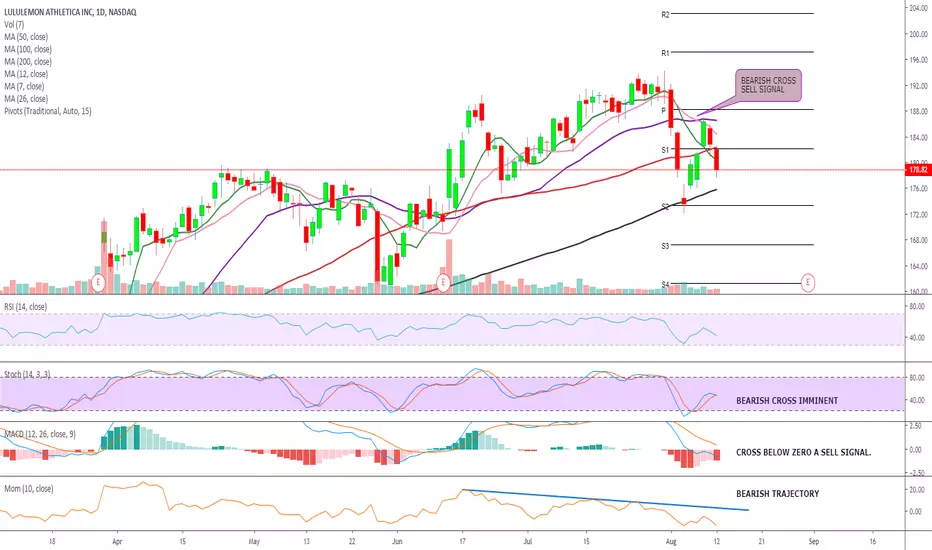
Watching for a breakout above 191.50 on increasing volume. Will only take a trade once that occurs, as want to keep the stop loss relatively tight on this one.
If this occurs, looking for a target between 220 and 240. Trailing stop loss can also be used.
Disclosure: no trade yet, but may open soon if conditions favor it.


$LULU 190 daily chart breakout on tap watching this one here to see if it cleans out that daily chart high

LULU Long (Naked Call)
Lulu has been solid channel up since December 2018. We broke new highs in early April 2019 and have since been grinding higher.
- At market close we are at a resistance level of about $190. If we gap up on Monday, I will be looking for an entry on a lower time frame at this same level of resistance to go long.
- However, if we get rejected at this price level, I will be looking for an entry when price touches the 21 EMA.


Inventory, Stock repurchases, Consumer SpendingFirst, I have to give credit when it's due. I went long on LULU's Q4 2018, that was fun!
Great 2018, definitely their best year, $3,288,319 of revenues.
If you have been long, nothing wrong taking profits off the table from here.
But hey look at this trend,
Repurchase of common stock for FY ended on:
2017: (29,327)
2018: (100,261)
2019: (598,340)
Now how do you go from 29 to 598 in a span of 2yrs? Fiscal stimulus aka TCJA beneficiary
Inventory:
2017: (5,403)
2018: (21,178)
2019: (85,942)
5 to 85 in a span of 2yrs. Inventory is growing. 285 stores in the U.S. only 22 in China, 64 in Canada
Currently trading at 183 near it's ATHs when rate cuts (if any) are being priced in. Also, because of buybacks while inventory grew rapidly, what would happen when the selling begins? Even LULU themselves warned on the risk factors:
From Current 10-K, Risk Factors:
Factors affecting the level of consumer spending for such discretionary items include general economic conditions, particularly those in North America, and other factors such as consumer confidence in future economic conditions, fears of recession, the availability and cost of consumer credit, levels of unemployment, and tax rates. As global economic conditions continue to be volatile or economic uncertainty remains, trends in consumer discretionary spending also remain unpredictable and subject to reductions due to credit constraints and uncertainties about the future. Unfavorable economic conditions may lead consumers to delay or reduce purchases of our products. Consumer demand for our products may not reach our targets, or may decline, when there is an economic downturn or economic uncertainty in our key markets, particularly in North America. Our sensitivity to economic cycles and any related fluctuation in consumer demand may have a material adverse effect on our financial condition.
More pressing concerns:
Our sales and profitability may decline as a result of increasing product costs and decreasing selling prices.
These factors may cause us to experience increased costs, reduce our prices to consumers or experience reduced sales in response to increased prices, any of which could cause our operating margin to decline if we are unable to offset these factors with reductions in operating costs and could have a material adverse effect on our financial condition, operating results, and cash flows.
Our ability to accurately forecast demand for our products could be affected by many factors, including an increase or decrease in guest demand for our products or for products of our competitors, our failure to accurately forecast guest acceptance of new products, product introductions by competitors, unanticipated changes in general market conditions, and weakening of economic conditions or consumer confidence in future economic conditions. If we fail to accurately forecast guest demand, we may experience excess inventory levels or a shortage of products available for sale in our stores or for delivery to guests.
Our fabrics and manufacturing technology generally are not patented and can be imitated by our competitors.
Increasing labor costs and other factors associated with the production of our products in South and South East Asia could increase the costs to produce our products.
Among all the other factors.


Lululemon - Wait for pullback to bottom of channelLululemon is looking like a good long bet, with a recent earnings beat, bullish analyst ratings, and an upward-sloping parallel channel. I think its current upward curve is hitting trendline resistance, however, so hopefully we'll see a pullback to the bottom of the channel that will afford a buying opportunity for a long position.


LULU fundamental long after earningsLululemon reported earnings yesterday that were strong and further buttressed our bullish outlook on the apparel maker’s fundamentals.
Despite increasing trade war tensions, LULU has notably low exposure to China, with a mere 6% of inventory sourced from China. Nonetheless, the company has established a clear plan for dealing with the sourcing issues that could possibly result — the company will hedge with more air freight. As companies anticipate higher tariffs, ports could become congested. By flying in more products instead of shipping them by sea, LULU can dodge the problem. Lululemon CFO Patrick Guido said on Wednesday that they were “anticipating port congestion around the mid-to-late July time frame.”
Following Wednesday’s announcement, sell-side firms praised the good results and adjusted their ratings accordingly. Oppenheimer expects “continued sales strength,” Telsey rates outperform with “limited exposure to china and strong top-line momentum,” Canaccord Genuity rates a buy with a price target of $194, MKM Partners lifted its target to $215, and Cowen rates outperform, noting product and guest engagement which are set to continue through Q2 and beyond.
