British Banks Dodge a Legal BulletBritish Banks Dodge a Legal Bullet, but Still Face Billion-Pound Costs
Ion Jauregui – Analyst at ActivTrades
The UK Supreme Court relieves financial institutions from paying up to £44 billion over the car finance scandal. The FCA is preparing compensation plans that could cost up to £18 billion.
British banks have narrowly avoided a legal blow that threatened one of the largest payouts in their recent history. The UK Supreme Court ruled against applying broad compensations for inflated commissions on car finance agreements—a case that could have cost the sector up to £44 billion.
The decision was met with relief by the market. Shares of Close Brothers Group, Lloyds Banking Group, Barclays, and Bank of Ireland, all with direct or indirect exposure to auto loans, posted significant gains following the verdict.
However, the legal outcome does not mark the end of the matter. The Financial Conduct Authority (FCA) has announced it is working on a more limited compensation plan, which could result in payouts between £9 billion and £18 billion. Lloyds, one of the most affected entities, currently holds a provision of £1.2 billion, which its management believes will not need to be significantly increased.
Moody’s has rated the situation as credit negative for the UK banking sector, warning that despite the favorable ruling, regulatory and reputational risks remain.
Fundamental Analysis of Lloyds
Lloyds Banking Group (LSE: LLOY) remains a cornerstone of the UK financial system. Backed by strong capital ratios and a diversified portfolio, the bank has managed to weather regulatory and macroeconomic challenges in the post-Brexit, inflationary environment.
In its latest quarterly report, Lloyds posted a net profit of £1.63 billion, beating market expectations. The bank reported a ROTE of 15.3% and a CET1 ratio of 13.9%, providing a solid buffer to absorb potential future shocks. Additionally, the board announced an interim dividend of 0.92 pence per share, underscoring its commitment to shareholder returns despite ongoing uncertainties.
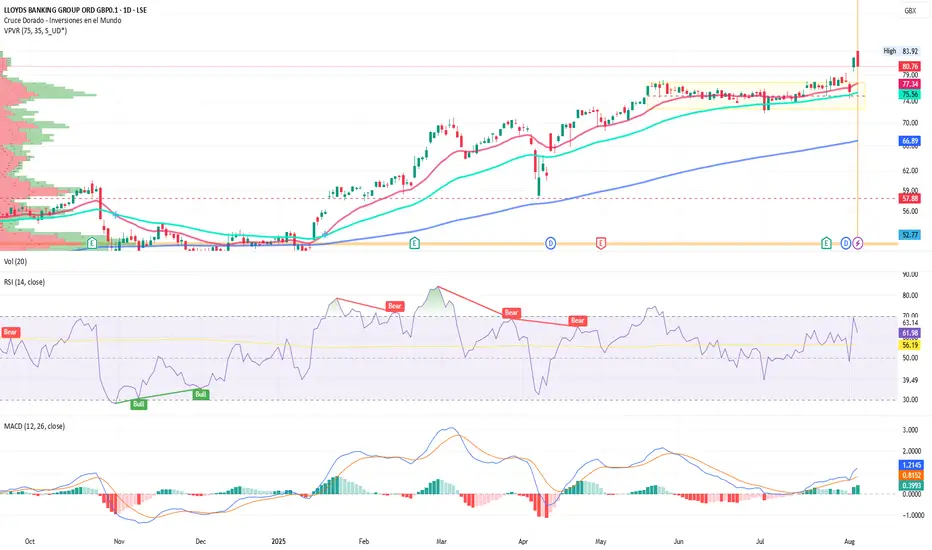
Technical Analysis of Lloyds (LSE: LLOY)
Lloyds has shown remarkable technical momentum so far this fiscal year. After hitting lows of £49.93 in January and forming a base that led to a golden cross of moving averages, the stock experienced a temporary dip to £57.88 following the announcement of new US tariffs.
Since then, the share price has advanced steadily, recently touching a new all-time high of £83.92 after forming a clear accumulation zone between May and July. This week, the stock decisively broke out of that range, entering what appears to be a potential “blue-sky” scenario, with no defined resistance levels above.
The move is supported by a bullish MACD crossover and increased trading volume, signaling momentum strength.
On the other hand, the RSI, currently at 61.98, indicates a slight moderation in the trend, especially after Tuesday's bearish candle, which could hint at a short-term correction toward the point of control (POC) at £75.20.
Key Indicators:
• MACD: Expanding, confirming strong upward momentum.
• RSI: At 61.98, suggesting moderate overbought conditions and possible pullback.
• Moving averages: Diverging, reinforcing the bullish trend structure.
Levels to Watch:
• Support: £77.50 – a break below this level could trigger a return to the accumulation zone.
• Resistance: With no clear ceiling in place, a continuation of the current breakout could see the stock approach the £90 mark.
In summary, while a short-term pullback is possible if regulatory pressure intensifies, Lloyds' technical outlook remains firmly bullish, supported by growing volume and strong momentum signals.
Dodging the Bullet
The Supreme Court ruling provides short-term relief for the UK banking sector, but the financial impact of the car finance scandal remains unresolved. As the FCA outlines its compensation plan, Lloyds stands out for its solid fundamentals and bullish technical setup—albeit with room for short-term corrections. The UK banking industry, although momentarily having dodged a bullet, still faces unresolved regulatory challenges and market scrutiny. The case has reignited the debate around sales practices in the UK auto finance market, a segment that until recently had avoided the level of oversight applied to other financial products.
*******************************************************************************************
The information provided does not constitute investment research. The material has not been prepared in accordance with the legal requirements designed to promote the independence of investment research and such should be considered a marketing communication.
All information has been prepared by ActivTrades ("AT"). The information does not contain a record of AT's prices, or an offer of or solicitation for a transaction in any financial instrument. No representation or warranty is given as to the accuracy or completeness of this information.
Any material provided does not have regard to the specific investment objective and financial situation of any person who may receive it. Past performance and forecasting are not a synonym of a reliable indicator of future performance. AT provides an execution-only service. Consequently, any person acting on the information provided does so at their own risk. Political risk is unpredictable. Central bank actions can vary. Platform tools do not guarantee success.
LYG/N trade ideas
LYG LongI am an amateur trader. I sometimes enter into trades. Other times it is only an analysis. Trade with your own risk awareness.

Lloyds Bank Analysis - Continuous, Just as the Markets !This is a Thread, so Follow for Technical Analysis performed with TrapZone Pro & UMVD Indicators.
* Trend is Based on TrapZone Color
* Bar Colors give us Momentum Green from strong Up Moves. Red Bars point to strong Down Moves.
* Red UMVD = Selling Pressure & Green UMVD = Buying Pressure. Purple is for Divergence = Battle of Supply & Demand
--------------------
1-23-2024
Strong downtrend with RED TrapZone established for days now. Price is retracing a bit with GREEN UMVD coming in now. Bunch of Trapped Buyers !

LLOY, Gap Upward after cross a resistanceAfter a formation of a double bottom, we can see the price crossing the two resistance levels.
Making a Gap on Thurdays Open.
DMI is showing some bullish strength, RSI is at an extreme of overbought. Volume is increasing right now, after decreasing on Thursdays.
WIth these factors, the price it will probably try to close the gap or even test the new support level.

LLOY Pull Back Think we see a bit of a pull back on Lloyds from here. Would be looking at least the 50% line with a bit of luck.

LLOYDS Banking GroupBuy LLOYDS Banking GROUP an HOLD.
No Comments, much POTENTIAL and a very good INVEST to hold
No sell, hold, and make you LUCKY to see this in your PORTFOLIO.

LLOY medium/long term short Based on TA I predict Lloyds bank to have a continued bearish move over the next 3-6 months until it reaches its next strong support zone

Lloyds Banking group to 5.80Talk about a 180. As soon as the JP idea is finished L for Lloyds is next, and my what a different picture. It seems as banks in the USA collapse that UK banks are set to see some serious cash inflow.
On the above 2-month chart price action has corrected over 90% from 2007 and never recovered. Until now. A number of reasons now exist to be long, including:
1) A strong buy signal (not shown) prints.
2) Regular bullish divergence. No less than seven oscillators. Four to five oscillators printing on this time frame is incredibly powerful but seven?!
3) Inverse head and shoulders pattern confirms with a break above 2.80 with a 5.80 target.
Is it possible price action falls further? Sure.
Is it probable? No.
Type: Investment
Risk: <=6% of portfolio
Timeframe: Don’t know.
Return: 140% to begin with.
Stop loss: 1.60

$LYG with a Neutral outlook following its earnings #Stocks The PEAD projected a Neutral outlook for $LYG after a Negative Under reaction following its earnings release placing the stock in drift D with an expected accuracy of 66.67%.

LLOY being a good buy at IH&S highs?Lloyds Bank - 30d expiry- We look to Buy at 43.71 (stop at 41.98)
Broken out of the Head and Shoulders formation to the upside.
Previous resistance at 43.70 now becomes support.
We look for a temporary move lower.
Support is located at 43.70 and should stem dips to this area.
Daily signals are mildly bullish.
Expect trading to remain mixed and volatile.
A break of support at 45.30 should lead to a more aggressive move lower towards 43.70.
Our profit targets will be 47.88 and 48.88
Resistance: 47.35 / 48.00 / 49.85
Support: 45.30 / 43.70 / 43.00
Disclaimer – Saxo Bank Group.
Please be reminded – you alone are responsible for your trading – both gains and losses. There is a very high degree of risk involved in trading. The technical analysis , like any and all indicators, strategies, columns, articles and other features accessible on/though this site (including those from Signal Centre) are for informational purposes only and should not be construed as investment advice by you. Such technical analysis are believed to be obtained from sources believed to be reliable, but not warrant their respective completeness or accuracy, or warrant any results from the use of the information. Your use of the technical analysis , as would also your use of any and all mentioned indicators, strategies, columns, articles and all other features, is entirely at your own risk and it is your sole responsibility to evaluate the accuracy, completeness and usefulness (including suitability) of the information. You should assess the risk of any trade with your financial adviser and make your own independent decision(s) regarding any tradable products which may be the subject matter of the technical analysis or any of the said indicators, strategies, columns, articles and all other features.
Please also be reminded that if despite the above, any of the said technical analysis (or any of the said indicators, strategies, columns, articles and other features accessible on/through this site) is found to be advisory or a recommendation; and not merely informational in nature, the same is in any event provided with the intention of being for general circulation and availability only. As such it is not intended to and does not form part of any offer or recommendation directed at you specifically, or have any regard to the investment objectives, financial situation or needs of yourself or any other specific person. Before committing to a trade or investment therefore, please seek advice from a financial or other professional adviser regarding the suitability of the product for you and (where available) read the relevant product offer/description documents, including the risk disclosures. If you do not wish to seek such financial advice, please still exercise your mind and consider carefully whether the product is suitable for you because you alone remain responsible for your trading – both gains and losses.

LLoyds Bank in inverted and shoulders.Lloyds Bank - 30d expiry - We look to Buy a break of 43.71 (stop at 41.98)
Trading has been mixed and volatile.
A bullish reverse Head and Shoulders has formed.
43.62 has been pivotal.
A break of the recent high at 43.62 should result in a further move higher.
The bias is to break to the upside.
Our outlook is bullish.
Our profit targets will be 47.88 and 49.88
Resistance: 43.60 / 45.00 / 46.50
Support: 42.00 / 40.50 / 38.50
Disclaimer – Saxo Bank Group.
Please be reminded – you alone are responsible for your trading – both gains and losses. There is a very high degree of risk involved in trading. The technical analysis , like any and all indicators, strategies, columns, articles and other features accessible on/though this site (including those from Signal Centre) are for informational purposes only and should not be construed as investment advice by you. Such technical analysis are believed to be obtained from sources believed to be reliable, but not warrant their respective completeness or accuracy, or warrant any results from the use of the information. Your use of the technical analysis , as would also your use of any and all mentioned indicators, strategies, columns, articles and all other features, is entirely at your own risk and it is your sole responsibility to evaluate the accuracy, completeness and usefulness (including suitability) of the information. You should assess the risk of any trade with your financial adviser and make your own independent decision(s) regarding any tradable products which may be the subject matter of the technical analysis or any of the said indicators, strategies, columns, articles and all other features.
Please also be reminded that if despite the above, any of the said technical analysis (or any of the said indicators, strategies, columns, articles and other features accessible on/through this site) is found to be advisory or a recommendation; and not merely informational in nature, the same is in any event provided with the intention of being for general circulation and availability only. As such it is not intended to and does not form part of any offer or recommendation directed at you specifically, or have any regard to the investment objectives, financial situation or needs of yourself or any other specific person. Before committing to a trade or investment therefore, please seek advice from a financial or other professional adviser regarding the suitability of the product for you and (where available) read the relevant product offer/description documents, including the risk disclosures. If you do not wish to seek such financial advice, please still exercise your mind and consider carefully whether the product is suitable for you because you alone remain responsible for your trading – both gains and losses.


$LYG with a Bullish outlook following its earnings #Stocks The PEAD projected a Bullish outlook for $LYG after a Negative over reaction following its earnings release placing the stock in drift B with an expected accuracy of 66.67%.

Lloyds Banking UKSun Storm Investment Trading Desk & NexGen Wealth Management Service Present's: SSITD & NexGen Portfolio of the Week Series
Focus: Worldwide
By Sun Storm Investment Research & NexGen Wealth Management Service
A Profit & Solutions Strategy & Research
Trading | Investment | Stocks | ETF | Mutual Funds | Crypto | Bonds | Options | Dividend | Futures |
USA | Canada | UK | Germany | France | Italy | Rest of Europe | Mexico | India
Disclaimer: Sun Storm Investment and NexGen are not registered financial advisors, so please do your own research before trading & investing anything. This is information is for only research purposes not for actual trading & investing decision.
#debadipb #profitsolutions

A bear prediction for LLoyds?With the economic predictions ahead, I can only see one thing happening! It's been stuck in this trend since 2012!

Lloyds bank Share Price... Which way will she go?I'm not sure whether to short my whole position in LLOY, it looks like it's hit the bounds it's been following since 2015. Another drop to 20p looks quite likely, but it might bust out of this range considering the current "growth"/ mis reported inflation of the UK.
I may sell 20% at 54p and set a buy limit at 44 and 20p for 10% each.

Lloyds Bank: Buying the DipLloyds Bank - Short Term - We look to Buy at 50.06 (stop at 48.36)
Preferred trade is to buy on dips. Previous resistance, now becomes support at 50.00. 50 1day EMA is at 49.80. The 50% Fibonacci retracement is located at 50.18 from 44.36 to 56.00. This move is expected to continue and we look to set longs at good risk/reward levels.
Our profit targets will be 55.99 and 57.95
Resistance: 56.00 / 60.00 / 65.00
Support: 50.00 / 47.50 / 45.00
Disclaimer – Saxo Bank Group. Please be reminded – you alone are responsible for your trading – both gains and losses. There is a very high degree of risk involved in trading. The technical analysis, like any and all indicators, strategies, columns, articles and other features accessible on/though this site (including those from Signal Centre) are for informational purposes only and should not be construed as investment advice by you. Such technical analysis are believed to be obtained from sources believed to be reliable, but not warrant their respective completeness or accuracy, or warrant any results from the use of the information. Your use of the technical analysis, as would also your use of any and all mentioned indicators, strategies, columns, articles and all other features, is entirely at your own risk and it is your sole responsibility to evaluate the accuracy, completeness and usefulness (including suitability) of the information. You should assess the risk of any trade with your financial adviser and make your own independent decision(s) regarding any tradable products which may be the subject matter of the technical analysis or any of the said indicators, strategies, columns, articles and all other features.
Please also be reminded that if despite the above, any of the said technical analysis (or any of the said indicators, strategies, columns, articles and other features accessible on/through this site) is found to be advisory or a recommendation; and not merely informational in nature, the same is in any event provided with the intention of being for general circulation and availability only. As such it is not intended to and does not form part of any offer or recommendation directed at you specifically, or have any regard to the investment objectives, financial situation or needs of yourself or any other specific person. Before committing to a trade or investment therefore, please seek advice from a financial or other professional adviser regarding the suitability of the product for you and (where available) read the relevant product offer/description documents, including the risk disclosures. If you do not wish to seek such financial advice, please still exercise your mind and consider carefully whether the product is suitable for you because you alone remain responsible for your trading – both gains and losses.


Lloyds: Banking on Further DownsideLloyds Banking Group - Short Term - We look to Sell at 2.75 (stop at 2.90)
We look to sell rallies. We are assessed as being in a large channel formation with the resistance level located at 2.75. The bias is still for lower levels and we look for any gains to be limited. Risk/Reward would be poor to call a sell from current levels. Further downside is expected although we prefer to set shorts at our bespoke resistance levels at 2.75, resulting in improved risk/reward.
Our profit targets will be 2.30 and 2.10
Resistance: 2.75 / 2.80 / 3.00
Support: 2.40 / 2.30 / 2.00
Disclaimer – Saxo Bank Group. Please be reminded – you alone are responsible for your trading – both gains and losses. There is a very high degree of risk involved in trading. The technical analysis, like any and all indicators, strategies, columns, articles and other features accessible on/though this site (including those from Signal Centre) are for informational purposes only and should not be construed as investment advice by you. Such technical analysis are believed to be obtained from sources believed to be reliable, but not warrant their respective completeness or accuracy, or warrant any results from the use of the information. Your use of the technical analysis, as would also your use of any and all mentioned indicators, strategies, columns, articles and all other features, is entirely at your own risk and it is your sole responsibility to evaluate the accuracy, completeness and usefulness (including suitability) of the information. You should assess the risk of any trade with your financial adviser and make your own independent decision(s) regarding any tradable products which may be the subject matter of the technical analysis or any of the said indicators, strategies, columns, articles and all other features.
Please also be reminded that if despite the above, any of the said technical analysis (or any of the said indicators, strategies, columns, articles and other features accessible on/through this site) is found to be advisory or a recommendation; and not merely informational in nature, the same is in any event provided with the intention of being for general circulation and availability only. As such it is not intended to and does not form part of any offer or recommendation directed at you specifically, or have any regard to the investment objectives, financial situation or needs of yourself or any other specific person. Before committing to a trade or investment therefore, please seek advice from a financial or other professional adviser regarding the suitability of the product for you and (where available) read the relevant product offer/description documents, including the risk disclosures. If you do not wish to seek such financial advice, please still exercise your mind and consider carefully whether the product is suitable for you because you alone remain responsible for your trading – both gains and losses.

LLOYDS BANK - BREAKOUT ^^^ BUYLLOYDS BANK - Finding momentum looking to move upwards in the coming weeks a great investment opportunity of a lifetime
Lloyds Bank plc is a British retail and commercial bank with branches across England and Wales. It has traditionally been considered one of the "Big Four" clearing banks.
Lloyds Bank is the largest retail bank in Britain, and has an extensive network of branches and ATMs in England and Wales and offers 24-hour telephone and online banking services.
NYSE:LYG
LSE:LLOY
OTC:LLDTF
SIX:LLOY

Lloyds Bank - bullish one way or the other A couple of counts for this major UK bank. Both bullish although one of them calls for a larger correction first.....

Lloyds has to rise and hold above 50p to give me some beliefIve always been interested in how Lloyds seems to trade in 25p blocks between 25, 50 and 75 pence. We presently see price running into the 50pence level which has been a strong level in the past.
So for me we need price to get above 50p and hold above it before I'm convinced that it has further energy to move towards 75p.
