BofA note: Revenue strength could ease AI spending uncertaintyStrong Q can reinforce confidence in AI ad engine: With AI ROI a key stock sentiment driver, 2Q positives could include:
1) Ad rev upside reinforcing confidence in Meta’s AI ad engine,
2) strong road map for 2H ad products,
3) optimism on new revenue opportunities for AI (Llama licensing, subscriptions, etc.) With Street likely anticipating 2Q revenue upside, risks are high expectations and higher expenses offset revenue revisions. Also, EU regulatory uncertainty is likely to continue.
AI positioning optimism reinforced by performance:
Given recent CEO posts, we expect big focus on AI investment and opportunities on the call, with possible updates on Llama and AI monetization strategies. Given audience scale, we continue to see Meta as one of the best AI opportunity stocks, with potential revenue upside as AI capabilities are integrated into the ad stack. At 24.5x our 2025 EPS, and with more investment coming, continued rev. momentum (which we expect) and a convincing AI product roadmap are key for maintaining sentiment & multiple.
META trade ideas

META WEEKLY TRADE SETUP – JULY 25, 2025
📈 META WEEKLY TRADE SETUP – JULY 25, 2025 📈
🔥 Institutional Bulls Are In Control — 3.05 C/P Ratio!
🚨 BUT — It’s 0DTE Friday, so don’t get caught in gamma fire.
⸻
🧠 Model Consensus:
✅ All Models = STRONG BULLISH
⚠️ Entry Timing: Monday preferred (due to gamma + time decay)
📉 Volume still weak = caution on conviction
⸻
🔍 META Flow Stats:
• 🟢 Calls: 65,379
• 🔴 Puts: 21,409
• 📊 C/P Ratio: 3.05 = Institutional bulls stepping in hard
⸻
✅ RECOMMENDED TRADE – PLAN FOR MONDAY
🎯 Instrument: META Call Option
🟢 Strike: $720
📅 Expiry: August 1, 2025
💵 Entry Price: $0.97
💰 Profit Target: $1.45
🛑 Stop Loss: $0.49
⚖️ Confidence: 75%
🕒 Entry Timing: Market open Monday
⸻
⚠️ TRADE NOTES:
• Don’t enter on Friday – too much gamma risk
• Wait for volume confirmation Monday morning
• Expect short-duration swing (hold 3–5 days max)
⸻
📊 Smart money is bullish, timing is everything.
👍 Like & Follow if META is on your radar!
#META #OptionsTrading #0DTE #GammaSqueeze #BullishSetup #TradingView #WeeklyOptions #TechStocks

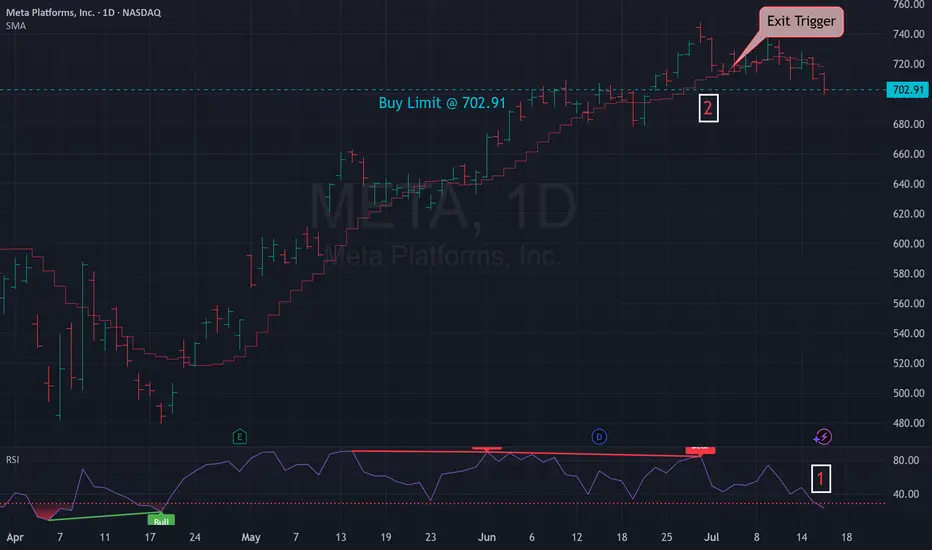
Mean Reversion Trade: META1. RSI in oversold region
2. Price likely to rebound back the the mean
Trade Rules:
Entry Trigger - RSI has cross below oversold region, enter limit buy at close price
Exit Trigger - Close at market when close price cross above exit trigger (Red step line)
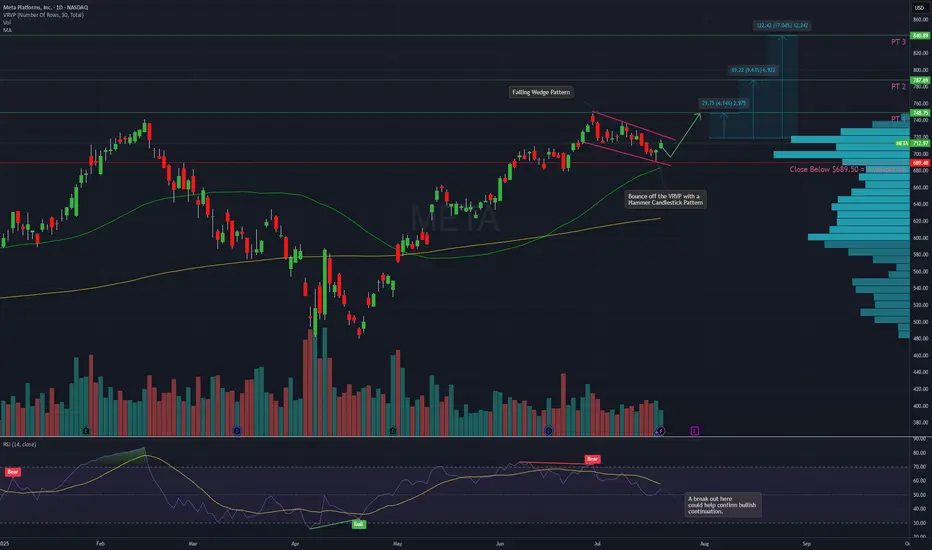
META – Falling Wedge Breakout Setup with Strong Risk/RewardDescription:
Meta (META) has been consolidating within a textbook falling wedge pattern, now showing signs of a potential breakout and bullish continuation.
Price Action Highlights:
Multiple rejections near 748 resistance
Recent bounce off the high-volume node on the VRVP with a hammer candlestick pattern
Holding above the 50-day moving average
RSI showing signs of reversal, approaching a key trendline breakout
Bullish Signal Criteria:
A breakout above the 720–725 range confirms wedge breakout
Watch for volume expansion to validate the move
Targets:
PT1: 748
PT2: 787
PT3: 840
Invalidation Level:
Close below 689.50 invalidates the setup
This setup offers a clear structure for continuation with well-defined risk levels and upside potential. Monitoring volume and RSI confirmation will be critical in the coming sessions.
Meta Stock Risks Breakdown Amid Slowing Growth and Rising CostsMeta (NASDAQ: META), the parent company of Facebook, will report second-quarter 2025 results on Wednesday, 30 July, after the close of trading in New York. The social media giant is expected to report that earnings growth slowed to 14.2% to $5.89 per share, as revenue growth decelerated to 14.4%, reaching $44.7 billion. CAPEX is expected to more than double from a year ago, increasing to $17.5 billion from $8.1 billion.
For the third quarter, analysts expect the company to guide revenue to $46.0 billion. CAPEX for full year 2025 is forecast at $64.7 billion. The options market is pricing in a post-earnings move of about 6.5%.
The stock has formed a potential 2B top reversal pattern when it briefly rose on 30 June, closed above the high seen on 14 February, but was unable to maintain it. Now, the stock has fallen below an uptrend that began on 1 May, as well as below technical support at around $705. Meanwhile, the Relative Strength Index has rolled over, suggesting momentum has shifted from bullish to bearish. There is considerable technical support for Meta between $680 and $700 per share, and a move below that support region could lead to the shares falling below $600 over time.
From an option gamma perspective, $700 appears to be the put wall, which also suggests there is solid support around this level. However, the overall call delta values are high, indicating that the options market is very bullish. Therefore, after the company reports, it is possible there could be significant call value decay, leading to the unwinding of hedges and potentially pushing shares below the $700 support region. However, if the stock can hold support at $700, it stands a chance to move higher towards the call wall at $750 and potentially as high as $800.
Written by Michael J. Kramer, founder of Mott Capital Management.
Disclaimer: CMC Markets is an execution-only service provider. The material (whether or not it states any opinions) is for general information purposes only and does not take into account your personal circumstances or objectives. Nothing in this material is (or should be considered to be) financial, investment or other advice on which reliance should be placed.
No opinion given in the material constitutes a recommendation by CMC Markets or the author that any particular investment, security, transaction, or investment strategy is suitable for any specific person. The material has not been prepared in accordance with legal requirements designed to promote the independence of investment research. Although we are not specifically prevented from dealing before providing this material, we do not seek to take advantage of the material prior to its dissemination.
$META Day Trade Update | 15m TF📈 NASDAQ:META Day Trade Update | 15m TF
VolanX DSS framework still intact. Price broke out cleanly from a descending triangle, retested the breakout zone near 713.8, and is now stabilizing above 714.6. We’re printing a bullish structure with momentum building toward:
🎯 Primary Target: 725.99
🧠 Fib Levels in Play:
0.618 = 711.47 (support held)
0.786 = 713.89 (pivot zone)
1.618 = 725.99 (target in sight)
📌 Key Observations:
Retest successful, no wick violation below triangle
Volume holding steady post-breakout
RSI/MACD divergence resolved on lower TFs
If momentum sustains, META may front-run 725 with a sweep into 728–731.5 extension. We’ll adapt based on order flow and price action near 722.5 resistance.
📡 Protocol: VolanX DSS | SMC + Fib + Triangular Structure
🔁 Still stalking. Exit at 725 or scale-out from 722 based on intraday momentum.

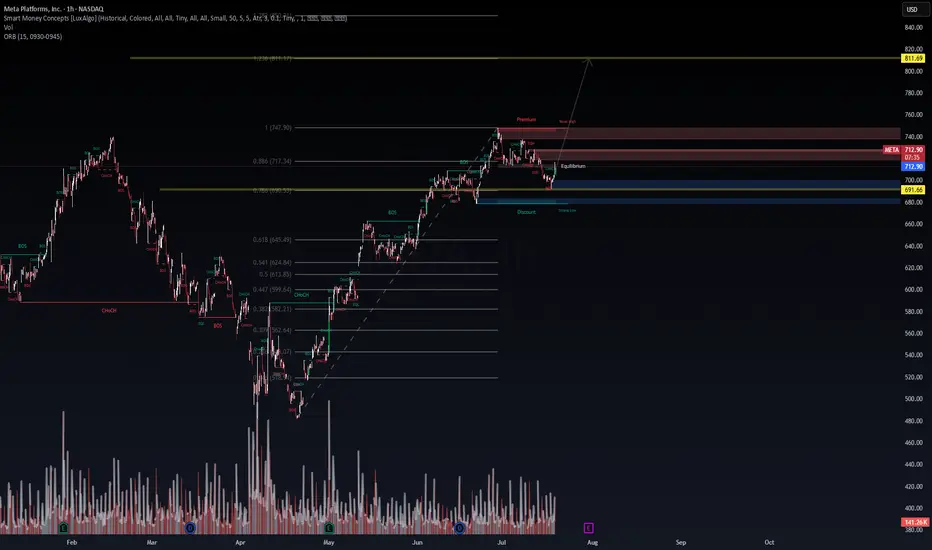
META – Institutional Buy Setup Active | VolanX Protocol Update📡 META – Institutional Buy Setup Active | VolanX Protocol Update
🧠 Price Intelligence Framework: WaverVanir DSS
The institutional model forecasts META to reach $760.64 in the next 15 trading days with a 95% confidence interval between $748.81 – $762.83. Signal is confirmed by 9/9 bullish model consensus.
🔍 Smart Money Concepts (SMC)
Price is rebounding from Equilibrium Zone (~$712.98) after discount mitigation. Liquidity structure favors bullish continuation toward:
🎯 Target 1: $727.63
🎯 Target 2: $760.64
🏁 Extended Target: $811.69 (1.272 extension)
📉 Risk Parameters (From DSS):
Entry: $713.36
Stop: $684.68 (4.0% risk)
Risk/Reward: 1.65:1
Volatility: 1.54% (low)
Capital Allocation: 25% of strategy layer
📈 Options Flow Validation:
Unusual activity observed across $720–$750 calls (Jul 25–Aug 22). Institutions are loading positions aggressively with >$2M notional in call sweeps.
Thesis: META is in an SMC bullish structure with alignment from AI forecasting, liquidity mapping, and options flow. VolanX Protocol confirms directional probability with low variance risk.
📌 Watch zone: $760 → $811
📌 Increased momentum if $717.34 (0.886 Fib) breaks cleanly
📌 Invalidation on close below $684
#META #VolanX #WaverVanir #SmartMoneyConcepts #OptionsFlow #TradingView #AITrading #InstitutionalSignals #Fibonacci #BreakoutSetup #LSTMForecast #TechnicalAnalysis
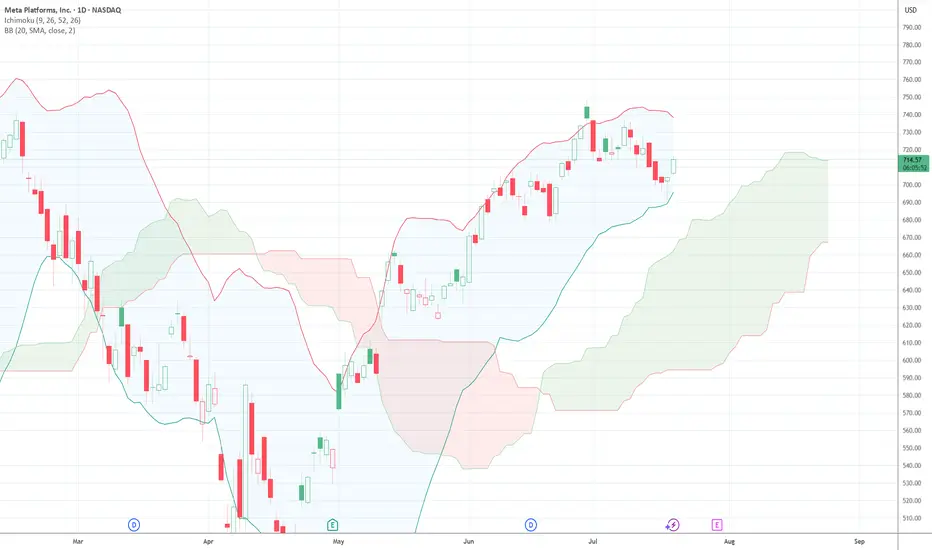
$META Cup & Handle? Wish I would have posted this pre market but I still like it for this week. Tapped the bottom band and it's bouncing and getting really tight now. Looks like a cup and handle near the all time high.
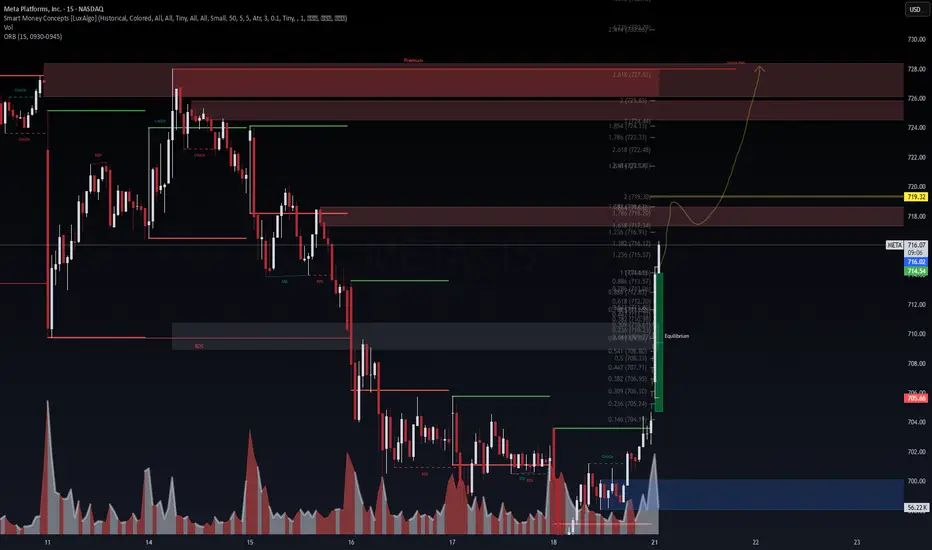
META 15M | Daytrade Setup – VolanX Protocol📈 META 15M | Daytrade Setup – VolanX Protocol
NASDAQ:META just delivered a high-confidence Break of Structure (BOS) + Change of Character (CHOCH) confluence off a low-volume sweep near the Equilibrium Zone (~$704).
Key Signals (VolanX Protocol):
✅ Smart Money Accumulation confirmed at blue demand zone
✅ Strong impulsive candle post-CHOCH (Volume Spike + Displacement)
✅ Fibonacci extensions line up with institutional targets:
📍 1.618 → $718.28 (First liquidity grab zone)
📍 2.0 → $719.30 (Equilibrium breakout target)
📍 3.618 → $727.62 (Full range sweep + premium zone)
🎯 Trade Thesis:
Targeting $719–$727 based on liquidity engineering and algo sweep probabilities.
🧠 VolanX Probability Curve:
📊 Move to $719.3 = 78% (aligned with 2.0 fib and historical rejection level)
📊 Move to $727.6 = 62% (final premium zone; sweep of June supply + “Strong High”)
⚠️ Retrace to $710.8 = 40% (retest demand or shakeout)
⏱️ Valid only for 07/21 NY session unless full structure invalidated.
💡 This setup reflects institutional liquidity dynamics governed by VolanX Smart Flow model. All insights are educational and part of the DSS framework.
🔁 Stay adaptive. Monitor BOS/CHOCH sequences. VolanX protects capital through real-time recalibration.
#WaverVanir #VolanX #META #DayTrade #SMC #DSS #AITrading #LiquidityHunt #VolumeProfile #TechStocks #TradingView
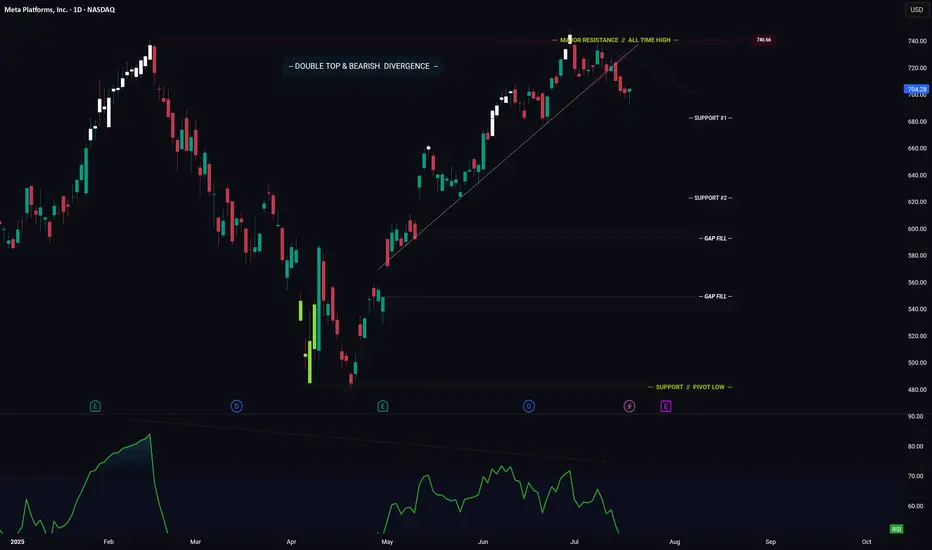
META -- Breakdown? Or Move Higher? Levels To Watch ForHello Traders!
Meta has broken down from its ascending trendline. This is bearish.
In addition price has formed a major Double Top pattern with Bearish Divergence.
Bearish Factors
1) Breakdown of ascending trendline
2) Double top
3) Bearish divergence
Two things need to happen if META is going to make a move higher...
1) Price needs to stay above "Support #1"
2) Price needs to break above the descending trendline (connecting the range highs)
IF price does breaks lower... where do we start looking for long positions?
- Support #2 is a great starting point, however if price makes it to support #2, then I could also see price trading down to fill the gap just below.
- This is where you could enter again to average down your position.
Thanks everyone and best of luck on your trading journey!
Stocks SPOT ACCOUNT: META Shares Buy Trade with Take ProfitStocks SPOT ACCOUNT:
NASDAQ:META shares: my buy trade with take profit.
This is my SPOT Accounts for Stocks Portfolio.
Trade shows my Buying and Take Profit Level.
Spot account doesn't need SL because its stocks buying account.
Looks good Trade.
Disclaimer: only idea, not advice

META Short📈 Scenario Outlook:
Bias: Bearish
Primary Expectation: Price is currently in a corrective decline and is expected to continue toward the 676.67 CHoCH level.
Bearish confirmation was seen upon rejection from the 713.20 mid-level, with price now printing lower highs and lower lows on the 4H chart.
This move may ultimately form a larger distribution pattern on the daily timeframe.
📌 Key Zones ("Your Borders"):
🔴 Mid-Supply Rejection Zone (Resistance)
Level: ~713.20 (50% equilibrium of last bearish swing)
This level acted as the midpoint during the retracement following the initial selloff from the top.
The market respected this region as a mid-range rejection, further reinforcing bearish momentum.
Failure to reclaim this level confirms bearish dominance in the short-to-medium term.
⚪ Target Zone / CHoCH Demand Test
Zone: 676.67 (CHoCH)
This is your projected draw on liquidity and primary downside target. It marks a structurally significant low where prior bullish order flow initiated.
If this level fails to hold, META may shift into a broader corrective phase, potentially unwinding a large portion of the prior rally.

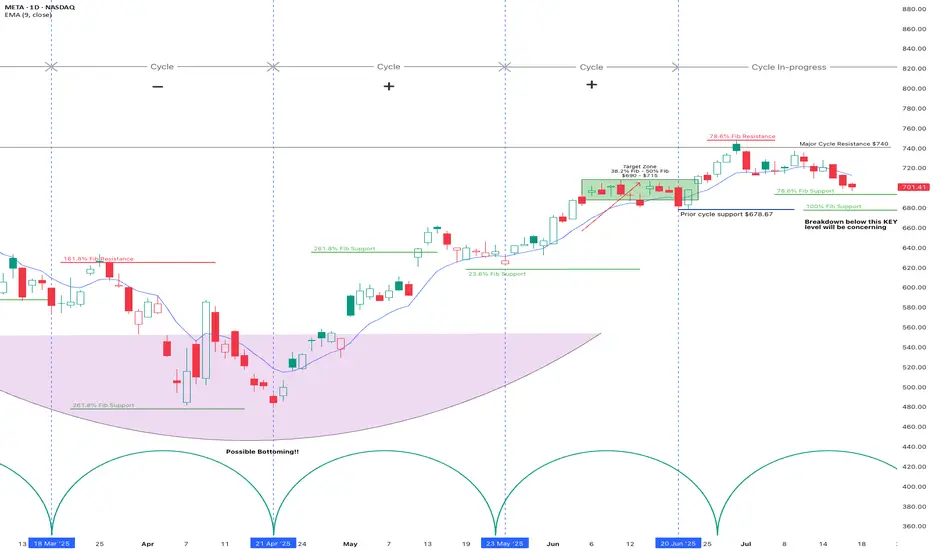
Is Meta breaking down?It's too early to tell. But investors need to keep an eye out for key support levels at $680 - $700
7/3/25 - $meta - Still a buy sub $1k/shr7/3/25 :: VROCKSTAR :: NASDAQ:META
Still a buy sub $1k/shr
- reality is, why would you bet against zuck
- his platforms are hitting on all strides. he is willing to internally build the best AI when he's falling behind by hiring the best talent and it is a LOT cheaper to hire for collectively $500 mm than say pay billions for a developed product and internalize it. great move Zuck!
- and their ad tools are second to none and don't suffer as much from "Google search" narrative as the ecosystem is one of those that's incrementally chipping away from Google.
- at mid 20s + PE, the stock is not "cheap" but it's actually quite affordable for the environment we're in
- some market POV: I think we've seen the "garden variety" pullback already. believe it or not... when you look at the individual names from recent highs, we've seen a lil 3 to 10% shuffle and not all on the same day (take for instance the TSLA dip the other day, large, and not on a day where nasdaq or other Mag7's were red).
- i continue to see small caps failing on large cap peers
- i see more money still floating lager caps higher at the expense of small caps, even tho it might look the opposite in the immediate term (this is a story as old as time... newbs chase quick thrills, get squashed and can afford less of the assets they should be buying to begin with). so word to the wise: if you've made some nice tendies lately on slightly more degen plays... buying stuff like Mag7's or even indices at highs is not necessarily a "bad" buy.
- anyway i like NASDAQ:META at sub $1k and sub 35x PE into the print
- would like to own more, so would be buying dips
- but think this is a winner in 2H
V

META - Double Top Currently Meta's double top around $750 is still in play. We wanted to watch the $710 level start to hold to climb back up but in early market we are still seeing a fall which could lead to our next lower support level around $680.
EPS data coming at the end of the month could signal if the trend will continue to be weak or if it is able to stay in line with the last few surprise prints and break through the key double top level.
The bearish divergence also shows us that currently the strength is starting to weaken in relation to price. Higher highs in price but lower highs on the RSI.

Before the Judge: Turmoil in Silicon ValleyIon Jauregui – Analyst at ActivTrades
Zuckerberg Takes the Stand
This week, Mark Zuckerberg appears as a witness in a civil lawsuit worth $8 billion, in which the governance of Meta Platforms (NASDAQ: META) is under scrutiny following the well-known Cambridge Analytica scandal. The plaintiffs — shareholders of the company — argue that decisions were made without proper board oversight, directly affecting the company’s value and corporate governance.
The trial also implicates other high-profile figures, including former executive Sheryl Sandberg, investor Marc Andreessen, Palantir Technologies (NYSE: PLTR) co-founder Peter Thiel, and former Netflix (NASDAQ: NFLX) chairman Reed Hastings. The central question is whether Meta’s board exercised independent and effective oversight in handling the crisis.
Temasek Reshapes Its Strategy in India
Singapore’s sovereign wealth fund, Temasek, has announced a shift in its investment strategy: fewer deals, but with higher concentration and larger individual commitments. Its current exposure in India exceeds $50 billion, and the fund believes the local market has matured enough to allow for easier entry and exit of capital.
Companies that could attract attention include major players such as Reliance Industries (NSE: RELIANCE) and Tata Consultancy Services (NSE: TCS)—key actors in sectors like technology, telecommunications, and financial services. Temasek values not only India’s economic growth, but also the opportunities for scalability and sector diversification.
Banking Sector Eyes Mergers
In the financial sector, Northern Trust (NASDAQ: NTRS) has drawn market attention amid speculation of a possible approach by BNY Mellon (NYSE: BK). A more flexible regulatory framework from the Federal Reserve has rekindled interest in M&A activity across the U.S. banking industry.
Major banks such as JPMorgan Chase (NYSE: JPM), Bank of America (NYSE: BAC), and Goldman Sachs (NYSE: GS) are closely monitoring the landscape, while regional players like PNC (NYSE: PNC), U.S. Bancorp (NYSE: USB), and Truist (NYSE: TFC) could also engage in strategic transactions aimed at improving efficiency and increasing market share.
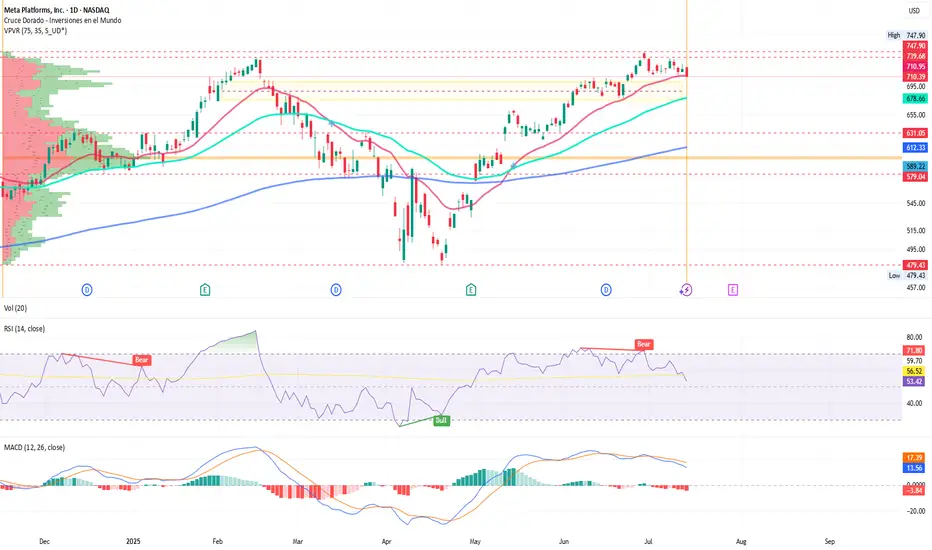
META in Focus: Technical Analysis
After reaching all-time highs in June near $747.90, Meta Platforms shares have slightly corrected, entering a consolidation phase around the 50-day moving average, which now acts as a key technical support level.
From a technical standpoint:
The price remains above the 50-day moving average since the golden cross in May, preserving the medium-term bullish structure.
The RSI stands at 53.42%, indicating a consolidation phase with no clear overbought or oversold signals.
Immediate support: $688 (100-day moving average)
Key support: $631, just above the point of control around $600
MACD: indicates short-term bearish pressure
Resistance: recent highs suggest a potential double top
A breakdown below the current support area could increase downside pressure, while a breakout above the all-time high, supported by volume, would resume the bullish trend toward new highs. The ongoing trial may bring short-term volatility, although much of the reputational risk appears to have been priced in by the market. Over the long term, investors continue to assess Meta’s strategic positioning in artificial intelligence, digital advertising, and virtual reality.
Conclusion
Silicon Valley is navigating a phase of heightened scrutiny—both in courtrooms and financial markets. As tech companies adjust their strategies and international funds recalibrate their positions, sectors like banking are preparing for potential consolidation. In this context, regulatory risk, governance, and strategic efficiency will remain key drivers in the performance of major U.S. corporations in the coming quarters.
*******************************************************************************************
The information provided does not constitute investment research. The material has not been prepared in accordance with the legal requirements designed to promote the independence of investment research and such should be considered a marketing communication.
All information has been prepared by ActivTrades ("AT"). The information does not contain a record of AT's prices, or an offer of or solicitation for a transaction in any financial instrument. No representation or warranty is given as to the accuracy or completeness of this information.
Any material provided does not have regard to the specific investment objective and financial situation of any person who may receive it. Past performance and forecasting are not a synonym of a reliable indicator of future performance. AT provides an execution-only service. Consequently, any person acting on the information provided does so at their own risk. Political risk is unpredictable. Central bank actions can vary. Platform tools do not guarantee success.

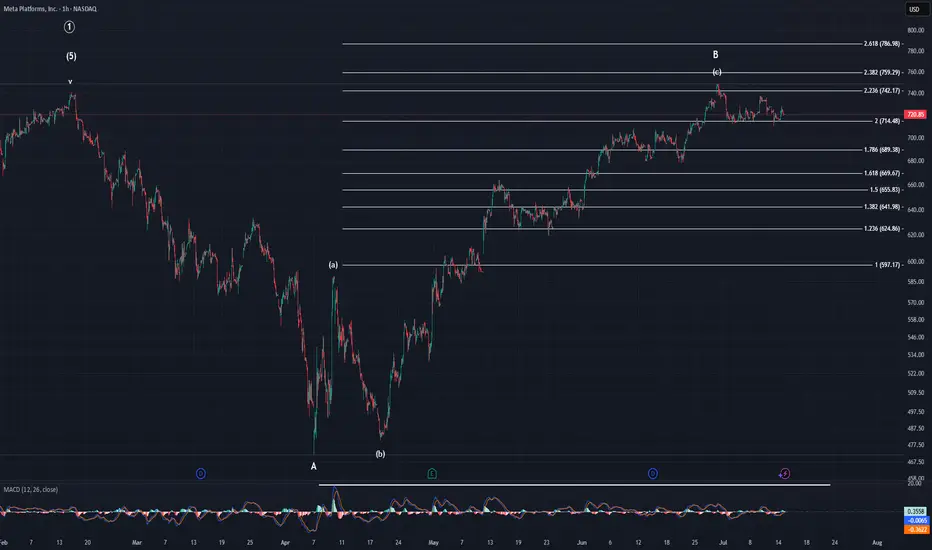
MetaSince the last post I made price has yet to make a new high. It has managed to chop in this area with a slight downward bias. If we're on the verge of the top of the indices, there is no reason to think Meta will continue higher much longer. This pattern, which is clearly corrective in nature, is way overextended. We started off with a 3-wave move higher off the April low and have risen all the way to the 2.236. Even if you could somehow say this is impulsive, it would still be over extended. So, no matter how you look at this pattern, it is in need of a correction. The question is how will that correction look. IMO, it will look like a minor C wave of intermediate (A). However, if it is somehow impulsive, then it would look like either minor A just now starting, or a smaller degree wave 2.
META | Accumulation Zone Identified — Road to $990?🧠 META | Accumulation Zone Identified — Road to $990?
📊 Ticker: META (Meta Platforms Inc.)
🕒 Timeframe: 1H
📍 Current Price: $717.36
📈 Bias: Bullish accumulation → Expansion
🔍 WaverVanir DSS Thesis
Our system has flagged a liquidity harvesting and accumulation phase between $676–$740. Institutional behavior suggests price is returning to equilibrium before a potential reaccumulation and markup.
🔑 Key SMC Zones:
🔺 Premium Zone: $729–$740 — recent rejection + liquidity engineered
🔻 Discount Zone: $676–$696 — ideal accumulation range
🔵 Equilibrium Pivot: ~$705
🟦 Volume Cluster: $716–$718 → short-term magnet and likely chop area
📐 Fibonacci Confluence:
0.786 Fib = $729.37 (converging with premium zone)
1.272–1.618 extensions → Targets = $870, $990+
0.618 retracement = $676.60 — deep discount level
🚨 VolanX Execution Logic:
Wait for sweep + displacement below $700
Watch for internal BOS + higher low formation
Confirmed entry above $729 = breakout of accumulation
Scale-out zone: $870 → $990+
🧬 Trade Strategy:
Leg Action Level Risk
A Accumulate $680–$705 Low
B Confirm Break $729+ Medium
C Profit Zone $870 / $990 High reward
⚡ Alpha Outlook: META is in a controlled markup with engineered pullbacks. This is where narratives shift, and the smart money loads. VolanX signals strong alignment with SMC zones — this may be a high-conviction multileg long.
#WaverVanir #VolanX #META #SmartMoney #TradingAlpha #SMC #Accumulation #Gamma #OptionsFlow #LSTM #DSS #AITrading #TechStocks #GrowthEquity #Fibonacci #TradingView

META Platforms Long Setup – Ready for the Next Move?💣 META Masterplan: Bullish Break-In Activated! 💼📈
🌟Hi! Hola! Ola! Bonjour! Hallo!🌟
Dear Money Makers & Silent Strategists, 🤑💰💸✈️
We’ve locked in on our next high-value digital vault: META Platforms Inc.
Built on our signature Thief Trading Style™ — where fundamentals meet stealth technical precision — this is your map to the bullish jackpot.
📍 ENTRY PLAN – Door’s Unlocked!
✅ Enter at any level — this heist is already in motion.
OR
🎯 Set your Buy Limit on a 15m/30m swing low or high — classic pullback infiltration.
🛑 STOP LOSS – Your Exit Route
Before breakout? Hold the line.
After breakout? Drop your SL at the recent 4H swing low – and size it to your risk appetite.
This isn’t luck — it’s calculated theft. 🔐
🎯 TARGET ZONE – Grab & Vanish
🎯 Aim: 770.00
But if the cops (aka sellers) show up early, get out with your loot — no shame in a clean getaway.
“Profit is the win. Perfection is fantasy.”
⚡ SCALPERS' TIPS – Quick In & Out
💵 Big wallet? Enter now.
💳 Tight budget? Follow the swing team.
Either way — longs only, and trailing SL is your safety rope.
📊 WHY META? – Intel Behind the Mission
🔍 This plan is reinforced by:
🔥 Strong Fundamentals
📈 Sentiment Signals
🧠 Quantitative + Macro Flow
💼 COT Data
🌐 Intermarket Correlations
It’s all aligning — the pressure’s building, and the breakout door is creaking open...
🚨 TRADING ALERT – Stay Outta Trouble
💥 Avoid placing new trades during major news drops.
🎯 Use trailing SL to protect and lock profits — your getaway vehicle must be ready.
💖 Support the Heist? Smash Boost!
Fuel the mission — every Boost empowers the crew.
This is Thief Trading Style — we don’t chase, we plan, strike, and vanish with the win. 🏆💪🐱👤
📡 Another breakout mission incoming. Stay hidden. Stay profitable. 🤑🚀

META (Meta Platforms Inc.) – Macro Compression Before Expansion META sits at a decisive macro juncture:
A clean SMC structure combined with Fibonacci premium zones signals an imminent directional expansion.
🧠 Macro Thesis:
Price is coiled just under 0.786–0.886 Premium Zone ($729–$760)
↳ This is a known trap area for retail liquidity – institutions often engineer sweeps here.
Volatility compression and volume tapering beneath the “weak high” setup
↳ Perfect conditions for either an engineered breakout raid or a sell-side liquidity hunt.
Fibonacci Expansion Zones:
🟢 Bull case: Clean path to $796 → $870 → $990
🔻 Bear case: Reversion into EQ → discount zones → $676 or $611
🗺️ Trade Structure:
🟢 Scenario A: Expansion Breakout
Entry: $729.50+ (break above weak high)
Target Range: $740.91 → $796 → $870 → $990
Stop: $710.04 (below EQ + EMA confluence)
🔻 Scenario B: Distribution Rejection
Entry: Break below $710
Target: $676 → $647 → $611
Stop: $729.50
📊 Institutional Alignment:
SMC shows liquidity-engineered structure with BOS + CHoCH confirmed
EMA 100/200 still rising → trend remains intact unless $675 fails
🧠 Positioning around EQ and premium zones is key. META is not in a “buy or sell” zone—it's in a smart money trap. Let price decide.
This is chess, not checkers.
📍 Posted by WaverVanir International LLC – Advanced Market Intelligence & AI Governance Engine
#Meta #META NASDAQ:META #SmartMoney #InstitutionalFlow #LiquidityZones #TradingPlan #FibStrategy #MarketCycle #SwingTrading #WaverVanirResearch #AITrading #VolanX #QuantStrategy #CapitalFlow #TradingView

META (Meta Platforms) – Battle at the Premium | WaverVanir Resea🚨 META is coiling at a critical inflection zone.
We're observing textbook Smart Money Concepts (SMC) behavior on both the daily and intraday timeframes:
🧠 Key Observations:
Price is hovering below the Premium Zone (0.786–0.886 Fibonacci: ~$729–$760) – a known liquidity trap.
15M structure shift shows a CHoCH (Change of Character) and BOS (Break of Structure), signaling possible upside.
Volume is tapering near a weak high – suggesting accumulation or engineered liquidity sweep.
⚔️ Scenarios in Play:
🟢 Bullish Breakout:
If META breaks and closes above $729.50 with strength and volume:
Long Trigger: $729.50+
Targets: $740.91 → $796 → $870+
Stop: Below $718 (EQ/EMA cluster)
🔴 Bearish Rejection:
If price rejects premium and breaks below $710:
Short Trigger: <$710
Targets: $676 → $647 → $611
Stop: Above $723
🎯 Strategic Outlook:
META is trapped between buy-side and sell-side liquidity. We’re watching for either a bullish expansion above weak highs or a reversion into discount toward deeper demand zones.
Volume and macro catalysts (e.g., earnings, tech sector rotation) will decide the direction.
📍 Posted by WaverVanir International LLC – Institutional Market Intelligence Engine
#Meta NASDAQ:META #OptionsFlow #SmartMoneyConcepts #TradingStrategy #VolumeProfile #Fibonacci #LiquidityZones #WaverVanirResearch #VolanX #TechStocks #MarketOutlook #InstitutionalTrading #LongOrShort #TradingView #SwingTrade #BreakoutSetup

META Holds Bullish Ground Above Support at $714.0#META dipped to a high volume area at $720.8, while critical support stands tall at $714.0. The market is bullish above this level, with the next target at $748.8.
