Cloudflare $NET H&S top !$NET formed H&S on top but depend on the market it’s could be failed H&S which usually become a bullish pattern with same target of the valid pattern .
NET trade ideas

NET levels to trade, targeting 85+ in medium term, good swing Cheap spreads, holding 80/85c april
70/75c 3/19 safe spreads and credit 65/70p 3/19 to help fund

Uptrend losing momentumWill probably see the price bounce either at the 60 or 56.5 price lines, overall starting to show a bearish tendency.
-----------------------
Hi! I am new in the TA world, comments and suggestions are highly appreciated!

Will NET Bring Cloud Back To Life?NET NYSE:NET is a riskier play at this moment due to the overall weakness in tech stock and market conditions. But, in comparison to other companies in this sector NET is holding up fairly well and showing some relative strength. NET tried to get over $76 today and failed to hold above. Testing a strong support zone for the third time over the past two months and looks like we may be starting to bounce. Volume has been accumulating with 4 out of the last 6 days trading above NET's daily volume average. POC on the daily chart is right at $82.51 lvl. If SPY/QQQ can start to breakout this week $$ should flow back into the tech stocks and the cloud sector which has taken a solid beating can see some bullish movement. Ideally, we gap up to $78 and form an island reversal. But, a play over $76 with the right market conditions looks primed for a good swing.
EMA's serving as a resistance above in the 78-79 range, tough lvls to get through in the Low Volume Node (LVN)
4/16 $80 calls will be my swing of choice (4.35/4.65). IV is very low 21% IV percentile on NET and if the market starts to move back up these can pay out well!
*I entered a small NET position this week and will add more on break of $76 with volume.

NET over 77.37NET has been beat up since earnings, had strong volume on Friday's trading session, is SlowStoch oversold on the daily, and could catch a bounce if tech does.

NETEntry at 80.73
Stop at 79.34
Confluences - Hourly Trendline Support / 61.8 of most recent uptrend /divergence
Estimated time 2-3 weeks


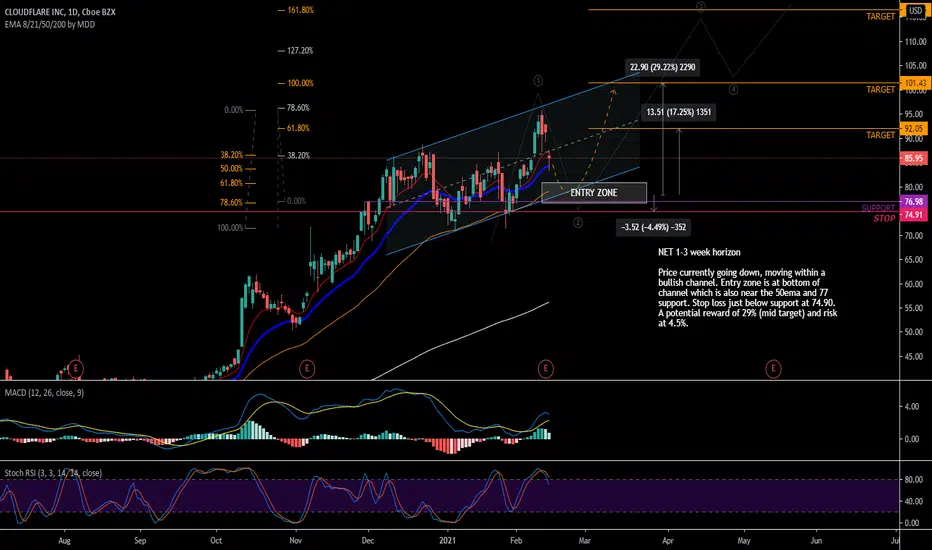
NETNET 1-3 week horizon
Price currently going down, moving within a bullish channel. Entry zone is at bottom of channel which is also near the 50ema and 77 support. Stop loss just below support at 74.90. A potential reward of 29% (mid target) and risk at 4.5%.
Disclaimer
I am not a registered investment advisor and do not offer investment advice and recommendation. All my post is not a recommendation, advise nor a suggestion and should not be used as a replacement for investment advice from a qualified licensed professional. All my post is for, information and entrainment purposes only. You, the reader, bear full responsibility for your own investment and trade decisions and should seek the advice of a qualified securities professional before making any investment or trade.
$NET Earnings Play + How to Trade Earnings In General(Note that I am writing this idea about an hour after market open when $NET is trading around $90)
Thought I would publish a quick idea on how I like to select and play earnings on stocks. $NET looks like a decent candidate as an example and actual trade.
Earnings reports represent an opportunity for a BIG move, but we just don't know WHICH direction. Many newer options traders like to buy single-legged options (calls or puts) at very near expirations to express a hunch or opinion on direction. The options appear cheap with HUGE payouts if you hit a home run. But those are overwhelmingly losing trades, even when you get the direction right. Why? Implied Volatility (IV) gets absolutely JUICED for earnings plays.
For example, suppose I am bullish on $NET earnings and want to buy a call-
Buying the ATM $90 Call for 2/12 expiration means $NET needs to move up to $95 just to breakeven, and about $100 to give you about a 1:1 reward to your risk ($520 profit to your $520 debit paid)
Buying an OTM $100 Call for 2/12: breakeven is at $102, $104 is 1:1 R:R
If you think going out to the next further expiration is better, it's not. The 2/19 expiry on those same strikes produces similar price points to breakeven and 1:1 profit
ATM Call for next week's expiration
OTM Call for next week's expiration
To some that trade might not look that bad, but what is not shown on these charts (generated from theoretical calculators) is the impact of IV Crush . If we close today at $90, ER happens after today's close, and we open tomorrow around, say, $95, and close around $93, those calls are going to lose most of their value . The reason for this is people paid(really, over-paying) for a big move that did not seem to come. Most earnings have their biggest moves AT earnings, not a week after. The momentum is largely lost.
Impact of Implied Volatility, IV Curve, Implied vs Actual moves for previous earnings
Unless you have a crystal ball for direction, you generally want to buy or sell volatility based upon the expected magnitude of event
What this means is if currently the IV is sky-high up front and absolutely plummets in the months afterwards, you look to see what previous moves did vs what their implied moves did. I look at MarketChameleon.com for this.
If the actual move of the last 12 earnings as well as the average move is about equal to or less than the implied move was, generally people are over-estimating the magnitude of the move
The IV Curve/term structure gives you an excellent opportunity to buy or sell volatility on one term relative to another. If IV has been climbing and looks like its cooling off, you sell it. If IV looks like its been calm and is starting to climb up, you buy it. This is explained best buy buying a straddle at one term and selling a straddle at another.
More common term structure. Implied Volatility is relaxed but expected to rise -sometime- in the future.
Term structure you get with most earnings events or when Reddit wallstreetbets gets obsessed with a stock.
What are 'IV30', 'IV60', etc?
Options are instruments of TIME
Because they are instruments of time, we are always looking at the price of something relative to the future, and the future is generally different Options Expirations (OPEX) dates, usually the monthlies. For stocks they are very interested in OPEX dates occurring around special events like an earnings report, dividend, or some kind of conference, results of a trial, economic event, and etc.
Generally options markets are looking ahead at intervals of about 30 days. You see this with CBOE's $VIX index, which tries its best to reflect the outlook 30 days from now
(Per CBOE FAQ on VIX: "Only SPX options with more than 23 days and less than 37 days to the Friday SPX expiration are used to calculate the VIX Index. These SPX options are then weighted to yield a constant maturity 30-day measure of the expected volatility of the S&P 500 Index.")
Here's how I am playing Cloudflare $NET earnings-
Sell a straddle for next Friday (surprise surprise).
Tomorrow's expiration is absolutely jacked on IV juice, but it is a little TOO near for my liking. What if NET moves up to close at $110 tomorrow, but if I had just one more week it could've settled closer to $100 and made me a profit?
Tomorrow's expiration IV is 170, which is about 40% more than next Friday's 120, and will surely get crushed extremely hard if it doesn't produce a good move, but I get 30% more premium selling next week's expiration (2/19), and that one will also plunge if there's a non-move
We buy a straddle at a further out expiration, one where the IV is far lower
The idea here is that we are mostly playing Theta/time. The hope is that if the stock doesn't move much the value of the near-term straddle sold goes down significantly, while the far-term we bought goes down, but not as harshly. There's also potential for the IV curve to balance out so that the near-term lowers a bit while the far-term rises a bit, giving value to our long straddle while leeching the near-term straddle we sold
Here are some guidelines playing with Double Diagonals/Calendars-
Set a limit buy on the option you sold to buy it at $0.05, Good Till Closed. If you're short on an option and its basically lost all that value, take your risk off the board for a measly 20-something dollars. Who knows if you celebrate early and then a massive move happens, you could have just eliminated that risk potential (Remember to close your long one as well, or replace the short you closed with a new one)
I like to close the spread before expiry and not allow an ITM option to be exercised. That adds another dimension of complications most are not ready to deal with
Consider rollouts. If you sell the 2/12 or 2/19 and we get a nothingburger, most of the crush has probably happened by tomorrow's open. You buyback (Buy to Close) your $90 call and put and now sell (Sell to Open) a later expiration date, like the 2/26 or even the 3/19 (if you did a diagonal, this would make it an Iron Butterfly, if you did not you cannot sell the $90s since you are already long, you'll have to roll those out)
In the rollout scenario, it is sometimes pretty ideal to have your long straddle be at a much further out date because you can rollout your short straddle several times
I find that generally you are much more protected on big moves to the upside, less so to ones on the downside. This is related to a number of things like Implied Volatility, Skew, etc, but it's not a bad idea to place your straddle a bit lower rather than higher. Look at your Theoretical Options Calculator and see what is the most likely scenario
Good luck and happy trading. Please let me know if you have any questions, comments, etc. I am always learning and am susceptible to writing something incorrectly or even having a misunderstanding of things :)

NET BUY OR LONG TARGET $105NET has a traditional setup of the " Double Bottom " pattern, with many favorite
features, a reasonable $87 buy point with Target: $105 , stop loss 6-8%.

DDOG, MDB, NET Price Action Analysis - Massive Move Coming?Find out why there is potential massive move coming and the key levels to watch for scaling in for NASDAQ:DDOG , NASDAQ:MDB and NYSE:NET . In this video, price action analysis together with volume spread with Wyckoff trading analysis is adopted to analyze these stocks.

NET - February 8, 2021NET has earnings this Thursday AMC. Expecting a strong push this week ahead of earnings to new highs. If we do not get it, will look at add more on dips to the lower range of this flag.
NET=95$?I think consolidation is over & we could see new ATH.
We do have some money flow to 95$ (options).
Good luck to everyone :)

NET Channel Short TermIf price breaks through either of these zones near this consolidation, might be a good place to get in.

NET possible breakoutNET
possible breakout here, first a cheat at around 73 and then cup completion /handle after 75
looking good to me: contraction, lower volume, positive buying, accumulation
earnings on the 11th

New ATH Imminent, Target $107With earnings next week 2/11 coming off an impressive Q3 report, and with such a bullish looking pattern, I'm expecting a pop out of this triangle. Based on past measured moves, the target would be around $107 if we do break past $85 and hold strong. Long term hold regardless of the outcome.


NET Daily Inside Bar SetupBullish cypher in consolidation phase may lead NET higher and Inside Bar gives us trading plan. Risk manage always!

NETIt is definitely a promising paper, and at the moment the Triangle pattern is being formed, which is fundamentally the stage of accumulating positions after the previous strong growth. A good moment for a long-term entry into an asset. In the process of growth, the price forms good support levels (shown by turquoise zones), which indicates good termination and interest of traders and investors. The price movement is expected along the lilac arrow and the achievement of the total trade target of $ 100.

NETBroke the 8/21 on the daily. See what happens tmrw. Cloud stocks might get a boost from msft earnings.

