weak chart! shortttOPEN in downtrend channel here, lots of better plays for longs imo but if you like puts/shorting this could be the stock for you ! :D
OPEN1 trade ideas
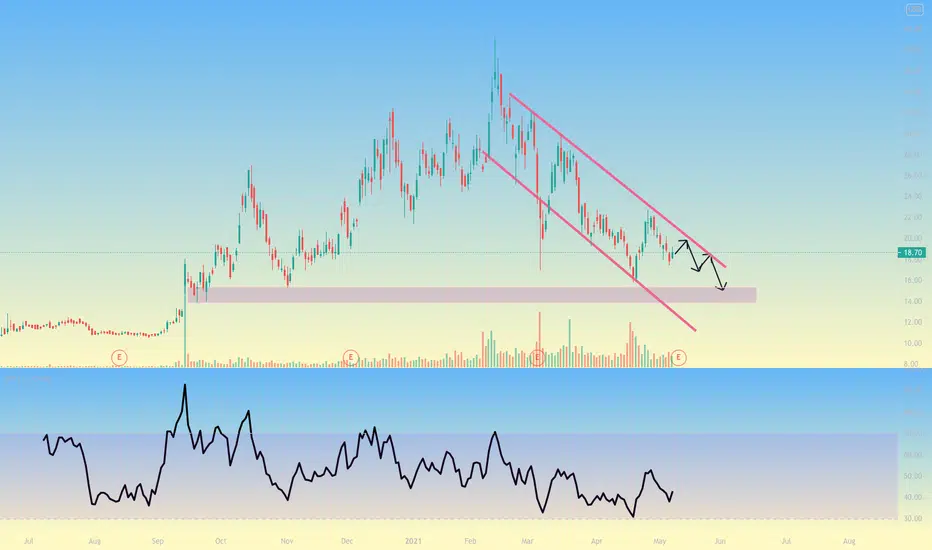

4/26 OPEN(1) support 15.92, 17
(2) break out the downtrend finally, and we see huge volumes on Thursday.
(3) keep eyes on it, because it is a good risk reward ratio
(4) keep in mind there are many resistance upside, credit play can be better in this chart

I GOT OVER #SPC #OPEN #CLO #SOCIAL CAPITAL #SPACSAND DISCUSS SOME OF THE PHILOSOPHY
OF CHAMATH PALIPATHYIA
A POTENTIAL WARREN BUFFET FOR THENEXT COUPLE GENERATIONS

$OPEN false breakdown, time to long?Opendoor Technologies Inc, one of ARKW's holding, had a false breakdown yesterday(4/12) and it seems to be wanting to retest some resistances.
Pros:
- RSI Bullish divergence on the 4hr chart.
- Seems to have found support with 5 EMA
- Price is close to the bottom of the BB, making it a good R/R trade
Cons:
- Volume has been decreasing, 4/12 breakout had a massive volume compared to the average. (Could be a false breakout to trigger stop-losses which are likely set on (3/31) low
- The stock follows ARK's trend, if ARK's ETFs underperform, it is unlikely that $OPEN will do well.
Critical levels:
Supports: 19 / 20.33 (5EMA)
Resistances: 21 / 22.95 (20MA) / 26.34 (50 EMA)
My position: Entry 21.02 / PT 28.5 / SL 19. Return so far -6.38%


OPEN, BREAKOUT COMING SOON!Hello fellow traders and investors, here's another trade idea.
OPEN has recently pulled back tand has made a double bottom and we are now waiting for the breakout of the wedge, if OPEN makes a recovery to the take profit trendline which offers around a 30 to 35% ROI.
Technicals:
The Macd indicates that it's oversold
The EMA's are in a downtrend
The RSI is oversold
When To Buy:
When it breaks out of the wedge.
When To Sell:
I recommend selling at the take profit trendline which offers around a 30 to 35% ROI.
Fundamentals: Opendoor Technologies, Inc. operates as an online platform for buying, selling and trading-in residential properties. OPEN has a debt/equity of 0.30, sales growth of -80% Q/Q, EPS growth this year of -318%, EPS growth next year of 33%, an ROI of -9.5%, a short float of 3% and I must warn that OPEN is a very volatile stock.
Rating: 25/100 the technicals are decent and the fundamentals aren't great but if it meets your criteria feel free to add it to your watchlist.
I hope you enjoyed this quick analysis and many more to come.
If you enjoyed leave a like, follow, comment your thoughts and share this trade idea.
Thanks.


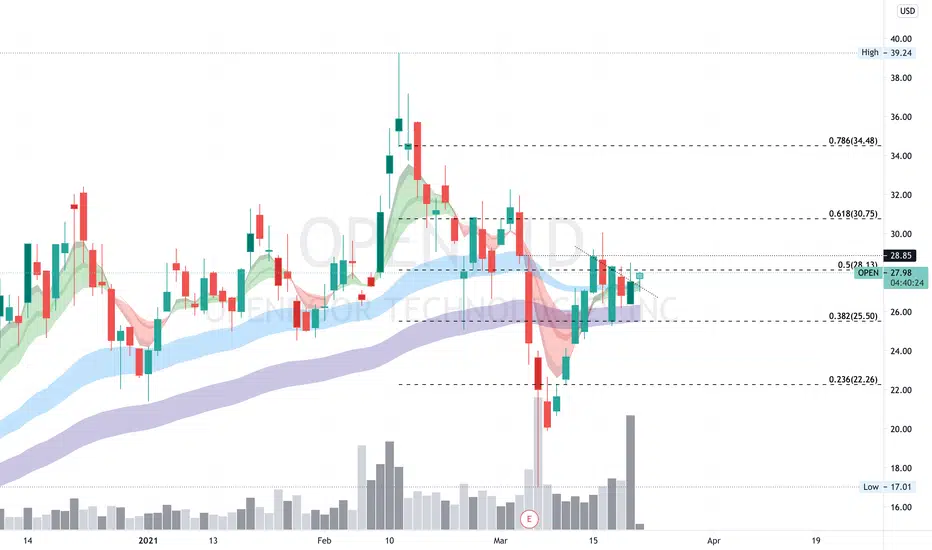
OPEN over 28.86Great looking chart with strong volume coming in the previous session, so far forming a hammer candle on the daily, looking for a move to re-test the 35.00 area.
OPEN 🌦They called me crazy but the actual pattern is following my bars pattern (the blue pattern). No indicators on my graph. I use fractals and pattern recognition theory to make judgments regarding the market.


$OPEN, Opendoor Technologies long trade$OPEN just had earnings and beat expectations but is still suffered heavily from the tech selloff. IMO the big selloff is unjustified and the stock held the lower support trendline. This is a great long entry for someone looking to make close to 80% gain to a new ATH.

OPENDOOR is TECH stock or ESTATE STOCK?!I believe OPENDOOR will chase after ZILLOW, even not too high
HALF of it will be my TARGET POINT
BUY LOW SELL HIGH, COLLECTION TARGET
1st 29
2nd 27

NASDAQ: OPEN Opendoor TechnologiesAdjusted the channel, now using the last 2 previous highs as the top touch points of the channel. Looking to see a drop to possibly $25 and hopefully going into next week we'll have that bounce we've been waiting on.

NASDAQ: OPEN Opendoor Technologies Inc.I'm a fan of this stock and their performance so far. This daily chart looks really good, let me explain. We have hidden bullish divergence on the MACD, our moving averages are looking like they might be about to cross (also a bullish sign), and it has been trading within this upwards channel for about 6 months now. I would usually like to use my mic to do this but I'm in the process of getting a new one. Again I like this stock, I think it looks like it has some room to run.

Economy opening up - interest rates slowly rising - Housing boomThe fundamentals and technicals are lining up for this name. This will be an industry disruptor as more consumers will switch to easier methods for buying and selling homes. We are expecting this housing season to be a boon with the rising interesting rates and home buyers scrambling to purchase homes. Price target: $42-45

OPEN in an uptrend next levels 31$ and 35$If it follows uptrend channel next targets are 31$ and then 35$ or higher.

Opendoor Technologies (NASDAQ:OPEN) successful retest?Opendoor Technologies (NASDAQ:OPEN) appears to have successfully retested the recent all-time high breakout in the form of a bull flag continuation pattern. This price action is bullish and suggests continuation of the uptrend. A protective stop-loss order could be placed right below the recent 29.07 low.


Possible bullish flag pennant forming? Interesting setup at the month view for Opendoor. Looks like a possible bullish flag pennant forming and a symmetrical triangle. Also dipped under 21 EMA and about to touch the 50 EMA. This is a very good sign. Also Stoch is bottoming out and looking to possibly go back up. Bullish setup???
Fundamentally Open just merged through SPAC and has a huge influx of cash to grow into other markets. Looks good to me. This is a Chamath Palihapitiya spac play and ARK invest has purchased a ton of it as well.
Experienced traders please your input is welcome.
