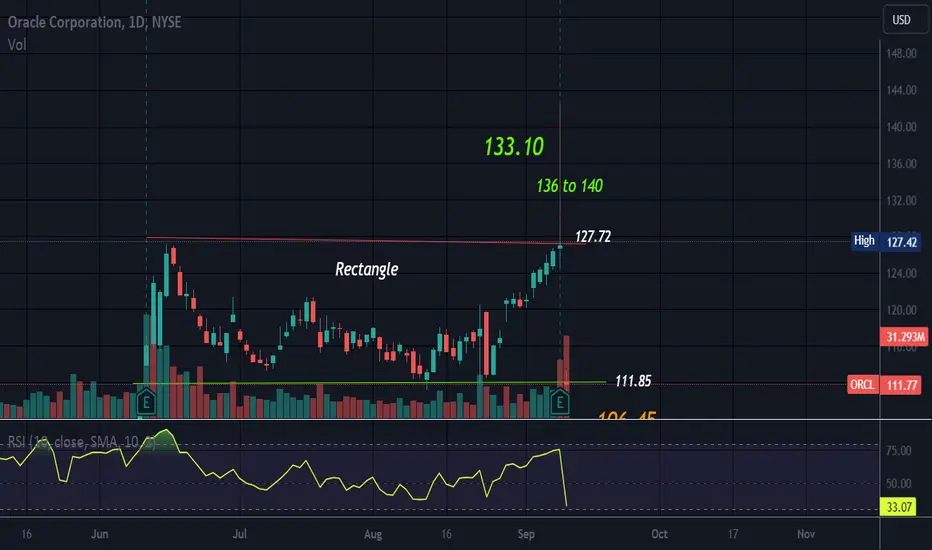
ORACLE DISCOUNT GET IT WHILE ITS HOT !!!ORCL buyers failed to make a decisive breakthrough at its recent pre-earnings highs. As such, sellers have defended ORCL's June 2023 resistance level of $127 resolutely. The surge toward its recent highs suggests that late buyers rushed in, anticipating a more robust outlook from management, but it didn't transpire.
Im expecting price to buy at one of the purple highlighted levels .
im long on the first level and if that dont work you know close and try again
ORCL trade ideas

ORCL(oracle corporation)Hi GUYS this is TUTORIAL post : you see how you could use pure technical chart for scalping though. that is clear 108 ---110(even number) is nice high potential zone for getting a bounce .......as of now you see this bounce is occuring ....always in gap filling area and in convergance of strong trend lines you are able to find high long probability setups.... THE more support you find more accurate your trade will be .
GOOOOOOD LUUUUUUCK

ORCL show an engulfment patternORCL show an engulfment pattern
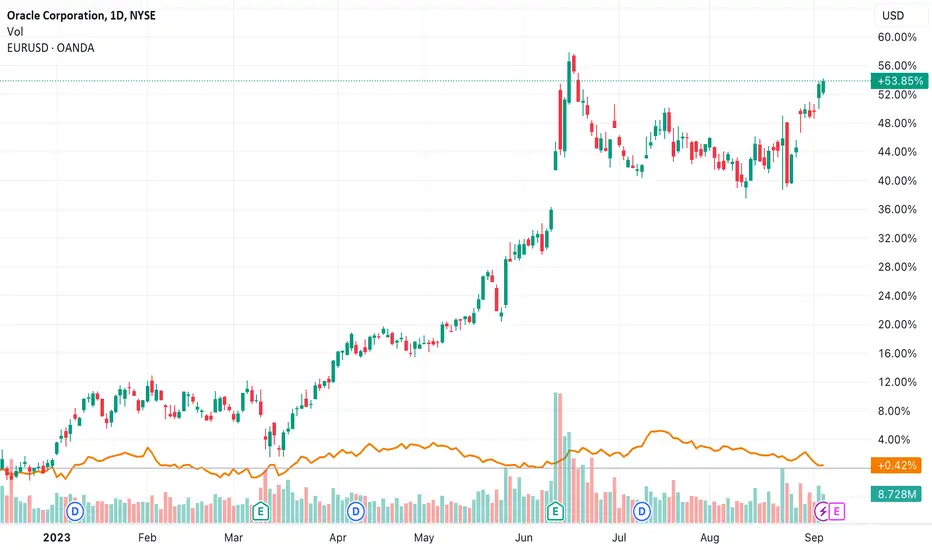
This chart shows the weekly candle chart of Oracle's stocks over the past year. The graph overlays the bottom to top golden section at the end of 2022. As shown in the figure, the high points of Oracle's stock in June of this year and this month formed a small level double top shape, and were suppressed by the 3.414 digits of the golden section at the bottom of the figure! Although the weekly chart of Oracle's stock has not yet closed, it has now shown a large-scale engulfment pattern, completely engulfing the gains of the past three months!

RectangleHorizontal trading channel that is neutral until broken.
Possible overvaluation concerning AI causing drop but not sure.
Spinning top/Indecision/Hanging on the support line today.
No recommendation
OrclLooking for a pullback/Correction here post earnings..
Price of this Stocks is 7% away from its 21ema. Last 2 times the price has been this Extended Oracle usually correction back to 21ema within days.
4hour CCI and MFI overbought
Showing a bearish rising Wedge formed from its 5% leg up last week.
Stop loss -128
Target 118-121
Bulls will see a handle forming on a Cup but only time will tell wink

Oracle Corporation (‘ORCL’)Oracle Corporation (symbol ‘ORCL’) share price managed to make around 14% in profits in the last 3 months managing to stay positive in performance.The company’s earnings report for the fiscal quarter ending August 2023 is expected to be released on Monday 11th of September. The consensus EPS is $0.90 compared to the same quarter of last year at $0.81.
‘ The company has seen better days in terms of financials since as of 31/05/2023 the current ratio was at 91% meaning that the company did not have the ability to repay its short term liabilities with the current assets at hand. At the same time the total assets were around $134 billion while the total liabilities were around $133 billion with more than $90 billion as debt indicating the fragile balance sheet of the company. ’ said Antreas Themistokleous, an analyst at Exness
On the technical side the price has moved aggressively to the upside reaching a 52 -week high of just above $127 despite the bad financials in late May. Currently the price is testing the resistance of the upper band of the Bollinger bands while the Stochastic oscillator is recording extreme overbought levels possibly pointing at a correction to the downside in the coming sessions. On the other hand the 50 day moving average is still trading above the slower 100 day moving average showing that the overall bullish momentum might still be valid.
ORACLE on a strong bullish break-out.Oracle Corporation (ORCL) made yesterday a break and 1D candle closing above the 0.618 Fibonacci level, confirming the bullish continuation bias with a standard technical break-out. The long-term pattern is best displayed by the Fibonacci Channel and as the stock price has just completed a 1D MACD Bullish Cross in more than three months, we are expecting a Higher High.
Based on the last two Bullish Crosses after bottoms, the price has always hit the 1.5 Fibonacci extension before a new consolidation. That is currently at $136.00 and is our new short/ medium-term target.
-------------------------------------------------------------------------------
** Please LIKE 👍, FOLLOW ✅, SHARE 🙌 and COMMENT ✍ if you enjoy this idea! Also share your ideas and charts in the comments section below! **
-------------------------------------------------------------------------------
💸💸💸💸💸💸
👇 👇 👇 👇 👇 👇

ORCL Textbook Bull Pennant Coincident With Index Support CatchORCL Upside break-out of a Descending Pennant.
Some things to note:
Hold of 50 EMA within the pattern
High volume entry into the pattern with descending volume throughout
Notable pickup in activity on the upside break
MACD Cross coinciding with break
Throwback following the upside break that tracks along the upper bound of the pattern and is halted at the 50 EMA
Measuring Implications for the pennant begin with a break out of a previous resistance to the top of the minor move that begins the pattern. The resulting move applies this distance to the beginning of the breakout of the pattern.
I have marked and color coded two potential areas to take into account when measuring for price targets, and marked volume POI's to justify those as start-points for their measuring.
PT1: 164
PT2: 143
SL: 50 EMA Break-down
Some other things going on that I observe:
SPX, DJIA, IXIC bouncing following minor (representing trend, not magnitude) decline
VIX 200 EMA rejection. Still cemented below 20 for now.
This analysis is for future price implications of ORCL.
I currently hold a position entered on AUG16.
Feel free to reach out for questions, including a review of a textbook pennant.
Manage Risk
Only invest what you are willing to lose
I warrant that the information created and published by me on TradingView is not prohibited, doesn't constitute investment advice, and isn't created solely for qualified investors.

ORCL printing a beautiful patternNYSE:ORCL Just successfully retested after breaking out of it's textbook triangles. I entered at $115 with a target of $136 with staggered profit takes at the Fibonacci golden zones.

Breakout or Breakdown | Have to waitWeekly Chart
Oracle NYSE:ORCL is in triangle pattern and moving to apex zone.
Besides, Oracle has the strong support by the ascending trend line
Daily Chart
Price is on the support and trading at 115.23 now
The second times, price touched the support so a massive move is coming soon
Triangle Pattern has more two scenarios can happen
Just wait and see

OrclEven with all the selling last week this tank managed to outperform.
Broke out of wedge early last week and back tested for the bounce friday..
Calls over 117
Target 121


Oracle - Short of the year?Holy moly good god Oracle is about to get slaughtered. Short of the year is forming on the Daily chart. Money flow is about to cross into red and it was extremely overbought on the AI narrative. Healthcare systems were also hacked so entire hospitals are/were down in early August. Fundamental + Technical analysis are aligned


Oracle Is Oversold Despite Barely DroppingOracle gapped to record highs almost two months ago, and now it could interest some trend followers.
The first pattern on today’s chart is the $114.34 level. It was both the opening price and low on June 12, the same day earnings and revenue beat estimates. The software company held that zone in late June, mid-July and again last week. Interestingly, it’s exactly $8 above the previous record high from late 2021. Has new support been confirmed above the old peak?
Second, the series of lower highs has produced a descending triangle. This may create the potential for a breakout.
Bollinger Band Width also shows volatility tightening. That narrower price action may result in price expansion if a breakout occurs.
Fourth, the 50-day simple moving average (SMA) has caught up with the stock during this period of sideways movement. Intermediate-term trend followers may view that as a potential entry point.
Finally, the stochastics oscillator has moved into oversold territory despite ORCL barely falling.
TradeStation has, for decades, advanced the trading industry, providing access to stocks, options, futures and cryptocurrencies. See our Overview for more.
Important Information
TradeStation Securities, Inc., TradeStation Crypto, Inc., and TradeStation Technologies, Inc. are each wholly owned subsidiaries of TradeStation Group, Inc., all operating, and providing products and services, under the TradeStation brand and trademark. TradeStation Crypto, Inc. offers to self-directed investors and traders cryptocurrency brokerage services. It is neither licensed with the SEC or the CFTC nor is it a Member of NFA. When applying for, or purchasing, accounts, subscriptions, products, and services, it is important that you know which company you will be dealing with. Please click here for further important information explaining what this means.
This content is for informational and educational purposes only. This is not a recommendation regarding any investment or investment strategy. Any opinions expressed herein are those of the author and do not represent the views or opinions of TradeStation or any of its affiliates.
Investing involves risks. Past performance, whether actual or indicated by historical tests of strategies, is no guarantee of future performance or success. There is a possibility that you may sustain a loss equal to or greater than your entire investment regardless of which asset class you trade (equities, options, futures, or digital assets); therefore, you should not invest or risk money that you cannot afford to lose. Before trading any asset class, first read the relevant risk disclosure statements on the Important Documents page, found here: www.tradestation.com .

Oracle in descending triangle.Oracle - 30d expiry - We look to Sell a break of 112.98 (stop at 118.98)
Daily signals for sentiment are at overbought extremes.
Trades with a bearish descending triangle formation.
113.43 has been pivotal.
A break of the recent low at 113.43 should result in a further move lower.
The bias is to break to the downside.
Our profit targets will be 98.98 and 96.98
Resistance: 118.00 / 121.36 / 124.00
Support: 113.43 / 110.00 / 105.00
Please be advised that the information presented on TradingView is provided to Vantage (‘Vantage Global Limited’, ‘we’) by a third-party provider (‘Everest Fortune Group’). Please be reminded that you are solely responsible for the trading decisions on your account. There is a very high degree of risk involved in trading. Any information and/or content is intended entirely for research, educational and informational purposes only and does not constitute investment or consultation advice or investment strategy. The information is not tailored to the investment needs of any specific person and therefore does not involve a consideration of any of the investment objectives, financial situation or needs of any viewer that may receive it. Kindly also note that past performance is not a reliable indicator of future results. Actual results may differ materially from those anticipated in forward-looking or past performance statements. We assume no liability as to the accuracy or completeness of any of the information and/or content provided herein and the Company cannot be held responsible for any omission, mistake nor for any loss or damage including without limitation to any loss of profit which may arise from reliance on any information supplied by Everest Fortune Group.

Bearish Alert : ORCL15 minutes chart
After 15 days a bearish traing range an without a real signal, we have now a new bearish alert with bearish crossover just showed up for a possible acceleration lower.
Waiting for a good price action to come.

ORCL - VCP Just spotted an intriguing #VCP pattern in $ORCL. The decreasing ATR and declining volume suggest potential for a significant breakout ahead. 🚀 Keeping a close eye on this one!

ORCL Large Cap Tech Setting up Bearish ContinuationORCL may not be joining the technology stock parade. Although it ran up
on the 2H chart with a good 30% rise between earnings. the MACD indicator
showed a double top. On the retracement, the price descended but then
stalled. It came up short of a 40-50% retracement and went sideways
into a flat top triangle. The MACD indicator has been with a negative
red histogram and now a downward-curving set of lines.
I see this as a short trade setup in stock not thriving in the technology
run-up. It could be that investors are simply deploying cash to far better
profit opportunities and not considering this stock as a good move.
Others may be already shorting this. I will join them.

Orcl pennantLong back to 130...
Short only on a close below 113.
Pennant formed here..
Stock has only dropped below its 50sma once this year and that was on earnings..
50sma is now at 113.70, so stock position + pattern makes this a good risk reward .

ORACLE Sell unless the Channel's top breaks.Oracle is on a correctional wave inside a larger parabolic trend.
As long as the price is inside the Channel Down (correction wave), sell and target the 1day MA100 at 106.85.
If the price crosses over the Channel Down, buy and target the 1.236 Fibonacci level at 130.50.
Follow us, like the idea and leave a comment below!!

ORCL | Informative NYSE:ORCL
If the price of ORCL breaks above the bullish line of $118, it may indicate a bullish signal, suggesting potential upward price movement. In this scenario, the target price could be set at $119.84.
Conversely, if the price of ORCL breaks below the bearish line of $114.34, it may suggest a bearish signal, implying potential downward price movement. In this case, the target price could be set at $109.25.

Orcl2nd Bounce off its 21ema today on low volume.
1hour MFI oversold .
As long as 115 hold I like a quick rally back to 120 By next week.
125 gap close is my final target.
Below 114.50 and were are heading to close 110 gap
