OXY - a bullish setup for the agesOXY is on the verge of breaking through a major resistance line which was first touched over a decade ago. As the daily chart repeatedly bumps up against, but not crossing, this key resistance line, multiple factors make OXY a screaming buy.
OXY1 trade ideas

OXY LONGOXY here on a weekly trendline
Bullish here at $56 to target 90.81 within a few months
Personally grabbed Jan 2025 calls
I think we either get a DIRECT bounce from this spot, OR we see a failed breakdown scenario first, but ultimately the target is the same.

OXY Gap Retrace and GoSimple Gap N Go on a nice Fib retracement, Gap might fill but will place stop below previous day low

OXY breakout to all time highFractal move from previous all time high could play out ( blue 🔵 line). Also we can see a breakout from a bull flag that could take us to all time hight now that the energy sector is heating🌡️up. In the shorter term we see a minor retracement to recent break out support line that was previously resistance. Upper Bollinger band is current short term resistance point

OXY at an APEXOXY has converging lines of resistance and support. Usually this means big move incoming. Waiting until a break and retest before entering.

Immediate buy on OXY!🔉Sound on!🔉
Thank you as always for watching my videos. I hope that you learned something very educational! Please feel free to like, share, and comment on this post. Remember only risk what you are willing to lose. Trading is very risky but it can change your life!

Update on OXY tradeI have decided to cover my initials since I am up 500$ per contact on these 70$ Jan calls. I am able to utilize this cash for more CLSK limit orders on the dip. I plan on keeping the other 66% of my OXY calls until at least my initial yearly target of 74$. I will then layer out and lock in the win. Congrats to anyone who used demand zones to buy into this exceptional trade, calling the CL (oil) bottom was also pivotal to this.

OXY hit first targetMy first target for the year just hit on OXY, my setup is 70$ calls in Jan. I plan on holding these longer since the oil reversal was so strong. My next target is 73.5$ which was my hopeful target for the year, but at this rate OXY could hit 80 plus dollars. This slow accumulation and dip into demand over and over is what caused this move, this alongside the oil reversal.
-I plan on holding my Jan calls until deep ITM if possible, I will definitely sell the contracts in the winter.

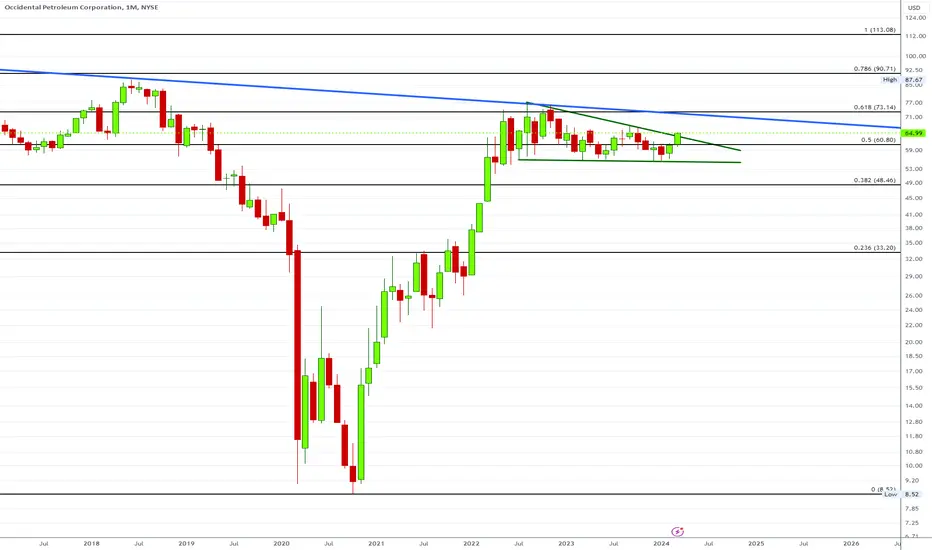
OXY Imminent Breakout This is a multi-year consolidation here that is on the cusp of breaking out.
Oxy over 66 triggers a breakout move into 73.14 where a multi-decade trend line will be tested. If bulls overcome that level the next target is 90.71
Oxy is THE setup of the decade.I do not think it is too late to reap the rewards, And I do not think there will be better opportunities to enter ever again. I believe oil is starting its third wave.
Bullish engulfing candle on the weekly here, and also on USOIL.
Long term support held, and failed to break down. There will be consequences for bears.
I think it is important to own an oil company with most of its exposure in the USA. This is the only land that cannot be negatively influenced by geo-political risk.
Other oil bulls appear to include - Warren Buffet, and Rick Rule.
I have included a fractal, they rarely play out exactly, but they serve as a rough guide to future expected price action.
My cost basis for this stock is 57.15, but i will be re-investing dividends over time.

OXY: Potential BuySeems like double bottom could be forming after rejecting a major S/R zone. Trend line as a first target. Final target at $66,7.

OXY updateOXY confirmed the wedge breakout on the weekly. I have a bunch of 70$ calls for Jan 2025, I wanted to tie up less capital to bet on oil prices increasing. This is the benefit of options vs spot. I can risk less money for more upside than just buying spot. Breakouts on longer-term time frames are much more reliable than lower term.
-Price targets remain 65$ short term
-74$ for the yearly

Stocks pairs trading: FANG vs OXYExploring the financial indicators and market behaviors of Occidental Petroleum Corporation (OXY) and Diamondback Energy, Inc. (FANG) offers crucial insights for investors looking to optimize their investment strategies in the energy sector. This analysis highlights the strengths and weaknesses of these companies, guiding investors towards making informed decisions that align with their investment goals.
Reasons to Consider Buying FANG Over OXY:
Valuation: FANG's P/E ratio of 10.52 is more attractive than OXY's P/E ratio of 15.51, suggesting FANG may be undervalued relative to its earnings potential. This could indicate a more compelling investment opportunity for value-seeking investors.
Forward P/E: With a forward P/E of 8.91, FANG is positioned as more favorably valued than OXY, which has a forward P/E of 13.83. This points to analysts expecting FANG's earnings to grow more efficiently compared to its current valuation, presenting a stronger future outlook.
Dividend Yield: FANG offers a higher dividend yield, with estimates ranging up to 4.51%, compared to OXY's estimated yield of up to 1.37%. This higher yield suggests FANG is more committed to returning value to shareholders, making it attractive for income-focused investors.
Market Performance: FANG has demonstrated superior performance metrics over the past year, including a year-to-date increase of 19.07% compared to OXY's more modest 1.41%. This outperformance underscores FANG's stronger market position and investor confidence.
Profit Margin: With a profit margin of 37.09%, FANG significantly outpaces OXY's margin of 13.24%. This higher profit margin reflects FANG's more efficient operations and superior ability to convert sales into net income, highlighting its operational excellence.
Growth Prospects: Despite a higher EPS growth next year projected for OXY, FANG's overall market performance, including its performance quarter-over-quarter and year-over-year, along with its strategic position within the energy sector, suggest that it has robust growth prospects. FANG's resilience and ability to adapt to market dynamics make it a potentially stronger investment in the long run.
Decision:
Buy 1 FANG: Considering FANG's lower valuation, higher dividend yield, superior profit margins, and impressive market performance, it emerges as a compelling buy. Its strategic market position and potential for future growth offer an attractive proposition for investors looking to capitalize on the energy sector's opportunities.
Sell 3 OXY: Given its higher valuation, lower dividend yield compared to FANG, and less impressive recent market performance, reallocating investments from OXY to more promising opportunities like FANG could enhance portfolio returns. While OXY shows potential for future EPS growth, FANG's overall financial health and market position suggest a more favorable investment outlook, providing a stronger case for investment reallocation.

OXY Ready to run?OXY is defending a major support once again after completing a bullish shark 2 months ago.
We are bullish on US Oil already and these stocks are looking ready also.
Bullish convergence at a major support level with a completed type 2 Bullish Shark.

OXY tests breakoutOXY and oil in general have been on a major upswing these last few weeks. This wedge I have been following for a while looks to be doing the retest on a breakout here. I have a moderate sized position in Jan 70$ calls for this wedge setup
- My first target is marked with dashed green at 65$
- My target for the year remains 74$
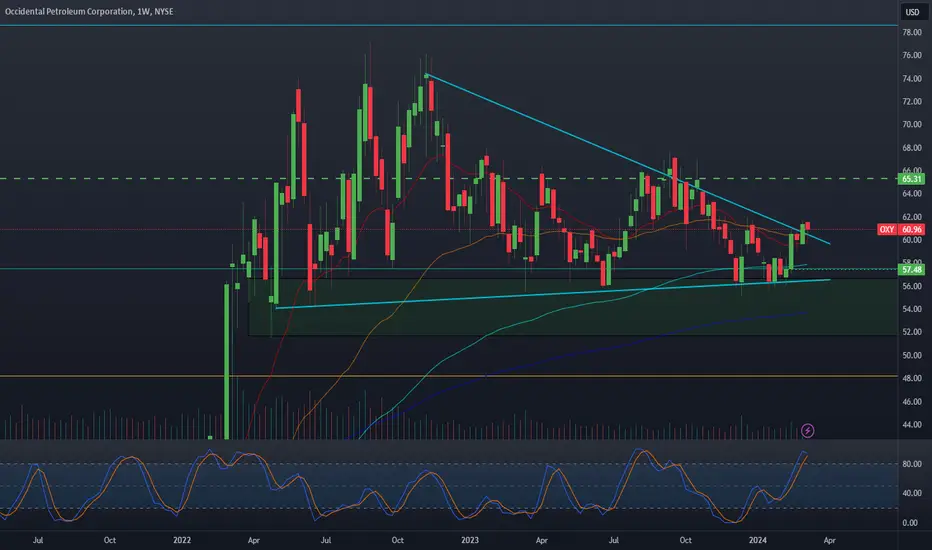

OXY tests breakoutOXY is testing a breakout here on the daily, it looks a little less powerful on the weekly but the wick has attempted. After the stock once again sipped from the demand zone will this finally be the breakout. With oil likely bottomed OXY is poised for my price targets.
-65$ short term
-74$ on the yearly
-This is one of my core positions for the long-term portfolio, my setup is 70$ calls for Jan 2025.

Long Target 75$1. Supertrend positiv
2. positiv accumulation
3. positiv squeeze
Targets marked with yellow dotted lines in chart

Box on OXYThe daily chart sees rising lows and a nice box above the ema 50.
The ema 21 is coming to create a bullish crossover that will be confirmed in case of breakout of the box.

OCCIDENTAL PETROLEUM Stock Chart Fibonacci Analysis 022124Trading Idea
1) Find a FIBO slingshot
2) Check FIBO 61.80% level
3) Entry Point > 60/61.80%
Chart time frame : B
A) 15 min(1W-3M)
B) 1 hr(3M-6M)
C) 4 hr(6M-1year)
D) 1 day(1-3years)
Stock progress : A
A) Keep rising over 61.80% resistance
B) 61.80% resistance
C) Hit the bottom
D) Hit the top
Stocks rise as they rise from support and fall from resistance. Our goal is to find a low support point and enter. It can be referred to as buying at the pullback point. The pullback point can be found with a Fibonacci extension of 61.80%. This is a step to find entry level. 1) Find a triangle (Fibonacci Speed Fan Line) that connects the high (resistance) and low (support) points of the stock in progress, where it is continuously expressed as a Slingshot, 2) and create a Fibonacci extension level for the first rising wave from the start point of slingshot pattern.
When the current price goes over 61.80% level , that can be a good entry point, especially if the SMA 100 and 200 curves are gathered together at 61.80%, it is a very good entry point.
As a great help, tradingview provide these Fibonacci speed fan lines and extension levels with ease. So if you use the Fibonacci fan line, the extension level, and the SMA 100/200 curve well, you can find an entry point for the stock market. At least you have to enter at this low point to avoid trading failure, and if you are skilled at entering this low point, with fibonacci6180 technique, your reading skill to chart will be greatly improved.
If you want to do day trading, please set the time frame to 5 minutes or 15 minutes, and you will see many of the low point of rising stocks.
If want to prefer long term range trading, you can set the time frame to 1 hr or 1 day.

OXY Occidental Petroleum Options Ahead of EarningsIf you haven`t bought OXY before the last run:
Then analyzing the options chain and the chart patterns of OXY Occidental Petroleum prior to the earnings report this week,
I would consider purchasing the 60usd strike price Calls with
an expiration date of 2024-5-17,
for a premium of approximately $2.32.
If these options prove to be profitable prior to the earnings release, I would sell at least half of them.

Occidental Petroleum Corp.: Bullish Bias. ContinuationTo be successful on Wall Street, it is important to be flexible and be able to recognize changing market winds - the patterns that tell investors when to get in and out of the market.
Sometimes a breeze is a warm and inviting wind: assets rise in value, and it seems that everyone is making money.
Other times, it turns into a violent storm, leaving in its wake financial destruction, memories of the past, and hope that better times are yet to come.
Occidental Petroleum Corporation (often abbreviated as Oxy in reference to the symbol and logo) is an American company engaged in hydrocarbon exploration in the United States and the Middle East, as well as petrochemical production in the United States, Canada and Chile.
The oil company, among other Value Investing Assets, has become one of the main beneficiaries of the weakening and reversal of WFH ("Working From Home") disinflationary trends that quickly shook the entire financial world against the backdrop of the Covid-19 pandemic in Q1 2020. But faded also just as quickly, while since the first quarter of 2021, in two years, many growth assets have been undermined, rocked by scandals, or completely destroyed.
It was revealed in March that Warren Buffett's Berkshire Hathaway added more shares to an already large bet on Occidental Petroleum, according to an SEC Form 4 report released on March 7, 2023.
The Buffett conglomerate bought nearly 5.8 million shares of the oil company over multiple trading sessions in March, at prices ranging from $59.85 to $61.90, according to the documents.
Berkshire now owns 200.2 million shares of Occidental, totaling 22.2% of the oil company's shares, up from 21.4% previously.
Occidental shares are currently among the top 10 Berkshire holdings. The energy company outperformed the S&P 500 index last year, more than doubling in price.
In March, Occidental CEO Vicki Hollub said in an interview with CNBC that she met with the 92-year-old investor, noting that they talked about the oil and gas industry and related technologies.
Last August, Berkshire received regulatory approval to buy up to 50% of Occidental, sparking speculation that Berkshire could eventually buy out the entire Occidental company.
Berkshire also owns $10 billion of preferred shares in Occidental and has warrants to buy another 83.9 million shares of common stock for $5 billion, or $59.62 each. The warrants were obtained as part of the company's 2019 deal that helped finance the purchase of Anadarko Occidental.
While many investors even now continue to believe in the crypto-snow that melted without a trace the winter before last, the technical picture indicates the possibility of Growth comtinuation in value investment assets, incl. Occidental Petroleum - after the completion of the 0.618x Fibonacci retrace to the Growth that began later to Russian President "Special Military Operation" announcement in Q1'22.
Also, the support of weekly SMA (200) in CL1! - Crude Oil Futures adds bullish bias to market participants.

Oxy monthly viewThis is a second expansion of my daily Oxy chart. When zoomed out this far the stock looks incredibly bullish. We are about to see an expansion of the monthly stochastic and a wedge contraction + potential breakout. 66-74$ this year imo.
