PBF: Excellent 'Time at Mode' signalsPBF is tracing a downtrend, sadly, since it didn't bottom at the recent low...I had to take a loss on my recent entries, and I'll wait for it to hit the lower targets to reenter. My idea is perhaps to short put options at the target, and either get assigned, or get profit from the premium on expiry. Either way, it's a great trade if we take the long side.
Fundamentals are good, and this is a good addition to any portfolio, we just need to time a good entry here and let it ride. The yield is worth it.
Good luck,
Ivan Labrie.
PBF trade ideas

PBF Likely to Go Down From Here, but Not by MuchI will be a big buyer at around $21.85, where there is rock solid support.

PBF Energy Inc $PBF - Big Pullback to Big Volume Support = Long$PBF energy is in the refining business and is a little-known company based out of Parsippany, NJ that has a new CEO in the last year and has faced plenty of challenges with operating its refineries.
Despite those challenges, you can see that $PBF has "FREE CASH FLOW" of $331 million for the last 12 months. The market cap of PBF is $2.33 billion, and throw in debt of $738 million, for an enterprise value that is nearly $3.0 Billion. The free cash flow yield is 14.2%.
Technically, PBF has pulled back after a major run up from $20 to $31 and is settling down to the $23-22 level where the most volume traded in the shares. See the mountain of volume on the right hand side of the chart which shows 'historical volume' that traded in the summer through the fall. Quite often, where previous volume traded, there are buyers who wish to buy more at that price and the decline finds support. Time will tell, but this is how you use technical analysis to help you make a buy decision here.
I would risk a drop under $21 and look for an upside move to $29-32 over the next 3-6 months.
I can fine-tune the entry, but $PBF is volatile and it is best to give it a fair-amount of room when entering this stock.

PBF Short Day TradeLooking to play bearish. Hoping for a quick retest of the 10 EMA after missing the Doji Entry

PBF: In an uptrend, buy dipsI'm looking to reenter PBF at support near the 27.55 mark. I've highlighted my recent trades in the chart, showing my exits and reentries. I'm adept at working like this instead of holding during corrections. I anticipate the turns based on price action around key levels, and the application of Tim West's 'self contrarian' signals that we use to time exits in good profits, or trail stops and add to positions.
What we do is constantly asessing our own emotions regarding our positions, specially the winning ones, since this gives us a great edge in finding good profit taking zones, and determining when to reenter positions.
I'd reccomend buying a position gradually near the 27.55 mark, starting as soon as Monday would be ok, but ideally the correction will last until December 14th which is what I estimate.
I'd reccomend opening a 7% size position if we hit 27.55, and you can look to add once in profit confirming the rally. Entering over a week would be better.
Good luck,
Ivan Labrie.

PBF -In Trump we trust.the rally I called for in summer was delayed and turned into a real monster breaking serious levels.-

PBF Energy Dec '16 PUT SPREADThis looks like a sure bet to me (and it's a good hedge against the SM Energy CALL SPREAD).
Buy: Dec '16 $22.50 PUT
Sell: Dec '16 $20.00 PUT
Initial outlay: $120 (net debit)
Maximum risk: $120 at a price of $22.50 at expiry
Maximum return: $130 at a price of $20 at expiry
BE at expiry: $21.30

PBF: Potential start of the up move herePBF has a solid setup here, it's bound to breakout above the highs soon, so we can start buying gradually until it shoots up.
Good luck!
Ivan Labrie.

PBF: Accumulated here, low risk longGo long PBF here, risk a drop to 18.70.
Valuation is very cheap, high dividend yield, and growth prospects for the long term.
Good luck!
Ivan Labrie.

PBF: Potential long term long zone and daily swing tradePBF has a nice bullish setup in the daily chart. After an extended decline, it's likely to move back up to meet the weekly downtrend mode after the time projected in the weekly expired right at the bottom. Daily charts are setting up as bullish with RgMov making a new high ahead of price, and a potential Time at mode uptrend signal about to confirm if the next daily bar stays above 22.70 until the close. In any event, probability of a move up is considerable, and specially backed by rising crude, SPY, and the recent shortage of fuel in South America, which greatly benefits U.S. refiners like PBF.
Long term longs can be established at these levels, risking a specific percentage weight in your portfolio, or perhaps you can take the technical setup here and go long risking either 3 times the daily ATR (I reccomend this) or risking a drop under 22.70 after Monday's close (if this level isn't retested).
Check out my updated track record here: pastebin.com
If interested in my real time whatsapp alerts and swing trading newsletter, or in personal tuition, contact me privately. I'm offering a considerable discount on a packaged course which includes access to my private trading signals list for a year.
Cheers!
Ivan Labrie
Link to Tim West's chatroom: www.tradingview.com
We discuss setups like this often there. Feel free to stop by and subscribe to his indicator pack. If you have any questions ask.
Risk disclaimer: My analysis is provided as general market commentary and does not constitute investment advice. I will not accept liability for any loss or damage including, without limitation, to any loss of profit which may arise directly or indirectly from use of or reliance0.25% on such information.

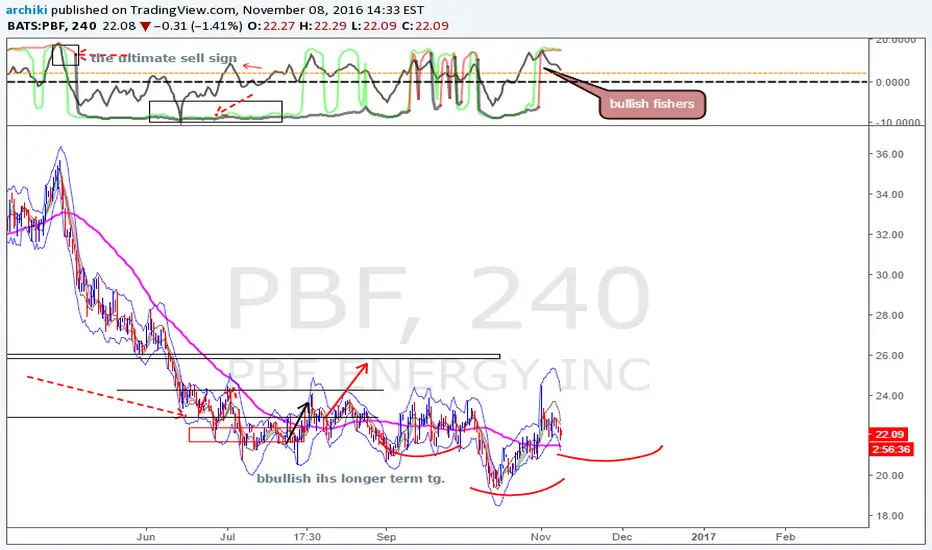
Long (or short opportunity)We've got a little head and shoulders going on here and as long as the neckline is not broken, we could enter for a long position for a target of $30. We have also a bullish divergence going on with the RSI, so, I will consider entering a long trade if the price touches the neckline again. Also, if the neckline is broken, we could short for a target of possible $23.

PBF: Reload longs!We should reenter PBF longs here, we had great results the last time, buying against earnings support. Risk either 1 or 3 ATR's down from here.
If interested in my trading signals, or in personal tuition, contact me privately. I'm offering a considerable discount on a packaged course which includes access to my private trading signals list for a year.
Cheers,
Link to Tim West's chatroom: www.tradingview.com
We discuss setups like this often there. Feel free to stop by and subscribe to his indicator pack. If you have any questions ask.

PBF: Interesting long in the makingPBF has broken the inside downtrend line, forming a mode after rallying above earnings resistance.
Free cash flow has turned positive recently, and the stock looks to be accumulated and ready to rally very soon.
The dividend yield is quite attractive and I think we can see some nice upside in due time intil FCF yield is low again.
Look to enter longs at market, specially if the day turns up tomorrow, keeping stops under 31, or using 3 times the ATR value for them.
PBF might benefit indirectly from the rising crude oil price, but it's a company that can do well even while crude is falling, which makes it an attractive stock to go long on dips.
Good luck if taking this trade.
If interested in my professional trading signals, or in personal tuition, contact me privately. I'm offering a considerable discount on a packaged course which includes access to my private trading signals list for a year.
Cheers,
Ivan Labrie.

PFE Energy Inc in the BUY ZONE for long term entryThe concept here is to use the KEY EARNINGS LEVELS as the important beginning and ending for your regression analysis. That way you KNOW the first and last points are extremely important price levels for the stock you are analyzing. Many times people use various, inconsistent methods to determine where to begin and end regressions and it yields unacceptable results. I am all about doing analysis that can be repeated and later re-analyzed, which is why I like my Time@Mode Methodology (see my other charts here at TradingView). \
I added a "hanging wire" to highlight the beginning and end of the regression (just for visual reinforcement)
I also added the "Range Expansion" that is happening today (see the tiny, white triangle and "+++ RgExp") to give me a heads up that someone is aggressively buying the stock today (or short covering) and that is always a good sign to begin to establish long positions.
As a side note: The ATR of PBF is at the lowest it has been in it's entire history, which doesn't mean that it is LOW RISK by any means, but it means it is LOW VOLATILITY. Low Volatility can mean "no interest" and it can mean a host of other things too, like a one-sided market where everyone is slowly doing the same thing (selling or buying) and driving a stock price in a particular direction waiting for some reaction back from the market, the company or Wall Street Analysts.
I put the "WOW" at the top there because that's when it looked like PBF was breaking out and acting unusually great... "WOW" seemed to fit nicely. It briefly continued the breakout, bringing in all kinds of technical breakout traders and then promptly dove down from there to wash out any hopeful breakout traders.
Do some Due Diligence. I went to the company's annual meeting in New Jersey in May (Parsippany) and didn't find out much from that, other than they don't like telling their story to a room full of investors. Only 4 outside investors were there.
For now, this is just informational for you to see how to draw "KEY EARNINGS LEVEL - REGRESSION POINTS"
Tim 26.73 last PBF 10:54AM Friday, June 5, 2015
