Short-term pattern IdentifiedThis is the most probable pattern for PCG is making right now. It is a flat, we are coming down in 5 waves for c of the flat. Should finish around ~6 area.
PCG trade ideas

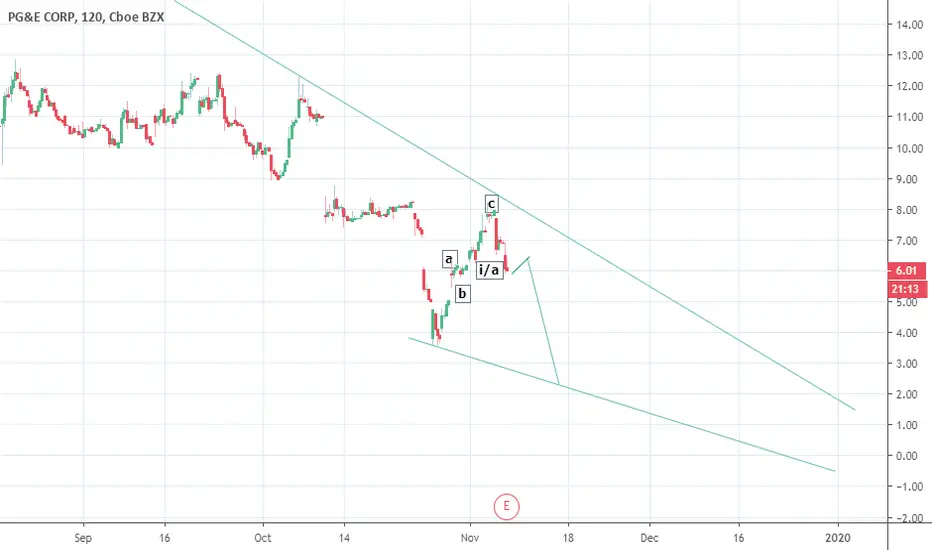
Updated short-term countLooks like a flat is going to be forming. ED of a subwave flat is finishing. If you look closely we have a flat within a flat within a flat. Don't be confused this is all corrective, the giveaway is all the overlap that is occurring. We are also bouncing off downtrendline that is acting as support.


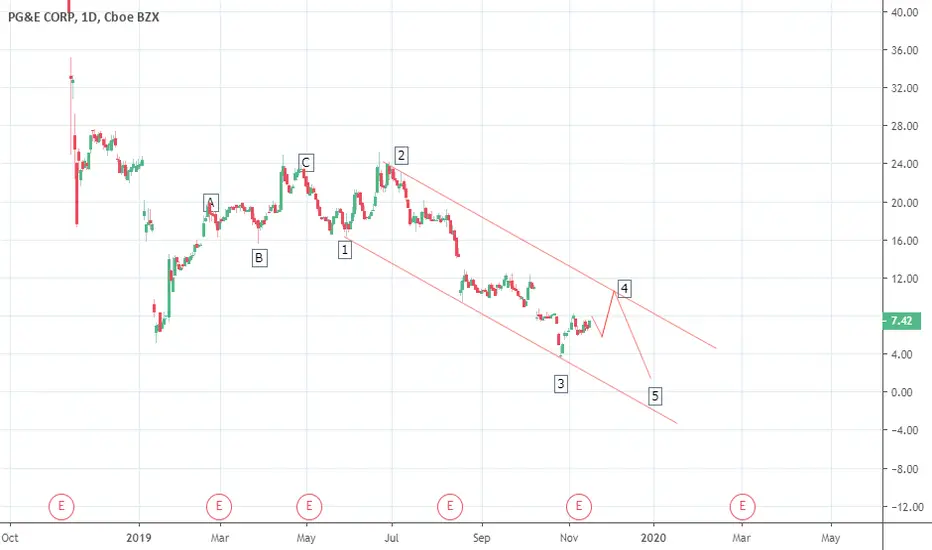
Long term pattern identifiedIf you've been following my work, you'll know I have alot of PCG EW counts. This one I think is the best. Zigzag for A, followed by triangle, look for 5 waves up to complete a flat.

alternative long-term PCG countAfter my daily stare at the PCG chart, I noticed that the low from January to the high in April was in 3 waves, and fits with a classic zigzag, but then there was some sideways movement afterwards. This could be sideways consolidation as part of the corrective move up from January lows. Or it could be a 1-2 as part of the down move that started as shown in the chart.
It's always important to keep an open mind. I believe this chart makes the most sense from a long to medium term stand point. If that is the case, then we are currently in wave 4 of this down move and will retrace to 10 area before falling below 3.
Also this current bounce is a lot weaker than Januarys bounce so I don't see us getting past 11 by the end of the year.
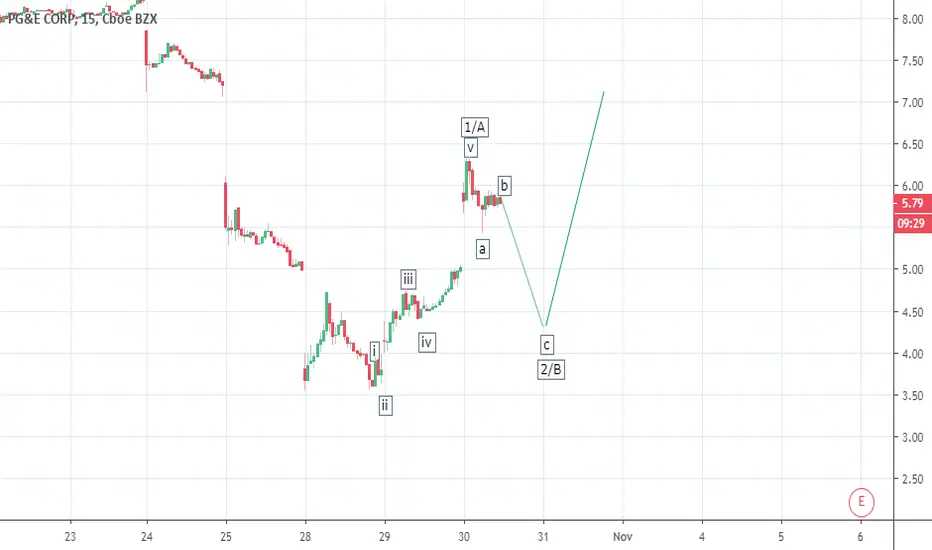
Updated short term PCG count2 alternatives are possible rn. We could be forming an Ending diagonal which would be a C wave labelled in blue or a flat labelled in Red. Either way we should be headed higher to retest 8, then drop.
The way to dermine which count will occur is to watch the current wave from yesterday's lows, if we complete in one more wave up, we will have 5 waves and we are dealing with a flat, however if we form another set of 3 waves up we are dealing with an ending diagonal.
The unlikely bullish count is we are in wave 3 and forming nested 3s. This imo is very unlikely.

Short term PCG count updateI was looking for 5 waves down to complete this correction. So far, it looks like we have 3 waves down. I have hard time counting this as 5, but it is definitely possible especially if the 4th wave is very small and an ED. The alternative is that this was only 1 and now we are making 2, which would lead to 3 down tomorrow tomorrow. I'm am still waiting for confirmation in my count before initiating a long position. So I will be looking for lower prices. This method provides the greatest confidence in entries and exits.


Triple Zigzag revisitedIt looks like we are in a possible flat correction from January of this year. If so, we are currently in the c wave and the next target is 20+. That will then lead to one final sell off in a Z wave.

Correct count for PGEIncorrectly labelled the up move as an impulse, it is more zigzag like. In a downtrend, 3 move up is likely corrective. So the correct count is is this. Should retest lows. I'm looking to short 23% retracement. Around 6.5


Thoughts on PG&ESome thoughts on PG&E:
Running along a short-term support line and about to run into a longer-term (once support, now resistance) line .
EMAs still have a little steam to push UP and MACD is showing signs of picking up momentum.
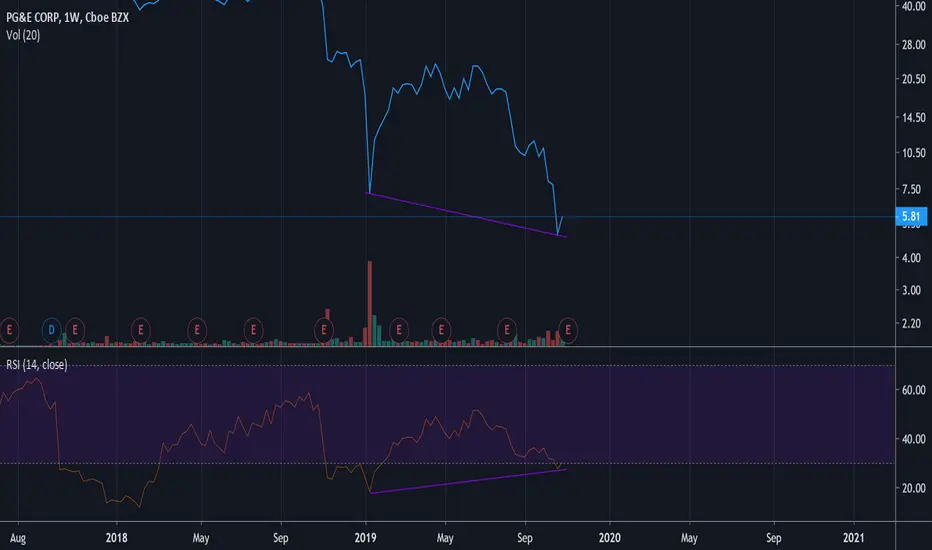
With the drops these last few days, the long-term RSI looks ready to jump, as well!
My vote says LONG.
However, fundamentals do weigh heavily at the moment and California keeps burning.

PG&E near a bottom?It appears PG&E is close to a bottom and the triangle formation is bullish on this last leg of the correction. I would watch that triangle close to see if it breaks or not. If not then I would shoot for the $1 - $2 range.

Pacific Gas and Electric RSI Bullish Divergence on the weekly.Once they start keeping customer lights on it's just a waiting game until this stock takes a moon shot given the obvious RSI divergence. It could go down to $2.00 after earnings. I am in this one long term and I cannot wait for it to one day to go back up to 45$
Double Zigzag PCG correctionAfter pondering over the chart some more, this count is more correct than my other count. THe X wave retraces exactly 61.8% on log scale, so this is likely a double zigzag and the correction is likely not over. We are still in a bounce though.

PCG triple correctionDifficult to say if c leg is down in Z wave, but we will need to test trendline first to see reaction. Excellent R/R here

Alex Vieira Offers $120 Million Profit to PCG InvestorsRefer to the previous chart and forecasts made available to everyone for free worldwide while Wall Street raised PCG Price target to $40

Baupost Group's PG&E Buying PatternIt seems like most of the funds who went big on that last dip at the beginning of the year were more so just doing it out of
desperation. It was like the risk reward was just so good and they were already down so much anyway -- might as well.
When you look at the chart, it looks like the obvious move was to sell in the 2nd, but nobody did


PCG turning bullish on WeeklyPossible entry level $12
Price target at FIB confluence $15. 20% upside .
Indicators are bullish after reversing of very low levels.
Sharpe deep decline from June highs correspond to the .786 FIB support, a very typical wave 2 retrace level.
Dominant buy side volume, but need 1 high volume day to break $11.50 resistance.
