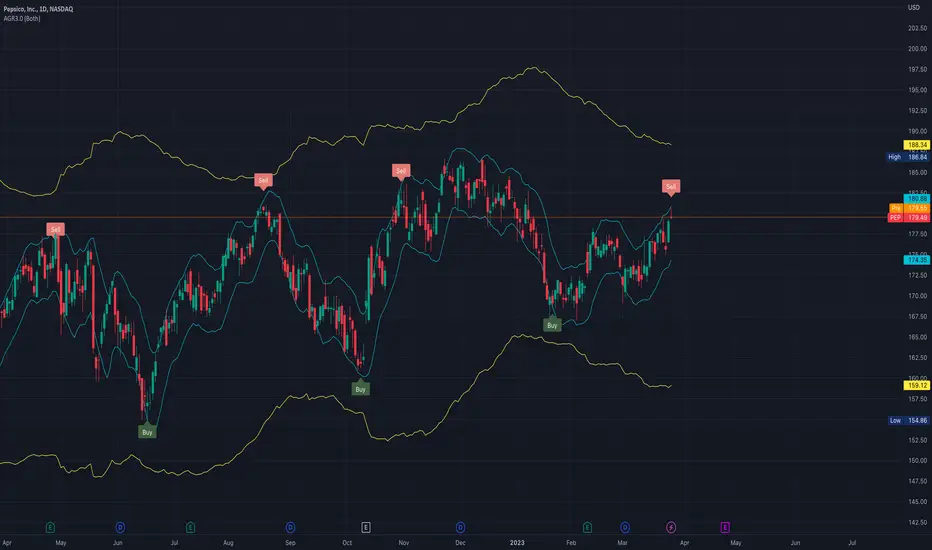
PEP - Breakout Ceiling of Rising Trend Channel- PEP has broken up through the ceiling of the rising trend channel in the medium long term, which signals an even stronger rising rate.
- The stock has also broken a rectangle formation.
- A decisive break of the resistance at 191 will signal a further rise to 218 or more.
- In case of a negative reaction, the stock has support at approximately 178.
- RSI above 70 shows that the stock has strong positive momentum in the short term.
- Overall assessed as technically positive for the medium long term.
*EP: Enter Price, SL: Support, TP: Take Profit, CL: Cut Loss, TF: Time Frame, RST: Resistance, RTS: Resistance to be Support LT TP: Long Term Target Price
*Chart Pattern:
DT - Double Top | BEARISH | RED
DB - Double Bottom | BULLISH | GREEN
HNS - Head & Shoulder | BEARISH | RED
REC - Rectangle | BLUE
iHNS - inverse head & Shoulder | BULLISH | GREEN
Verify it first and believe later.
WavePoint ❤️
PEP trade ideas

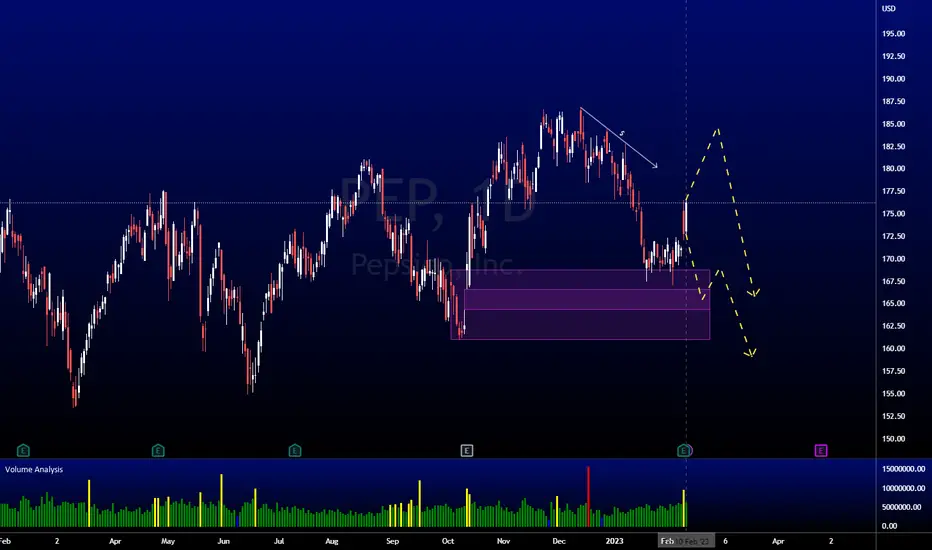
Pepsi has had an impressive move into resistance. A pullback in Pepsi is likely to occur.
XLP has been one of the best performing sectors YTD.
Pepsi has completed a measured move into resistance.
A massive deviation away from the mean should cause some profit taking in Pepsi.
If you look at the price of Sugar soaring recently this should eat into Pepsis margins moving forward.

PEP: Sell ideaOn PEP as you see on the chart we have the breakout of the vwap indicator and also the breakout of the support line so it's mean that we will have a big probability to have a downtrend.Thanks!

PEP PepsiCo Options Ahead Of EarningsIf you haven`t bought PEP here:
Then analyzing the options chain of PEP PepsiCo prior to the earnings report this week,
I would consider purchasing the 185usd strike price Calls with
an expiration date of 2023-5-19
for a premium of approximately $3.60.
If these options prove to be profitable prior to the earnings release, I would sell at least half of them, I expect a retracement afterwards.
I am interested to hear your thoughts on this strategy.


OVERBOUGHT//ABC/DPossible M pattern forming. I left the 3rd leg dashed as I am not sure this leg is complete. It could go higher and time will tell.
When leg 3 does complete, this pattern will often reverse to the downside.
ABC/D pattern as well which is also known to reverse down when D is reached.
Most likely a Shark forming
Earnings this am.
Overbought on RSI.
No recommendation.
T1 and T2 have been met.
Price is well above the .236 of the trend up.

PepsiCo bullish rally prior to earnings release
PepsiCo, Inc. (symbol ‘PEP’) share price has gained back all the losses incurred in the first quarter of the year and is currently trading at a slight profit. The company’s earnings report for the fiscal quarter ending March 2023 is set to be released on Tuesday 25th of April, before market open. The consensus EPS for the quarter is HKEX:1 ,37 compared to the same quarter last year of HKEX:1 ,29.
‘ The company’s share has been trading in a steady uptrend since early March with the technical indicators further supporting this notion of strong bulls. On the other hand the current ratio is not looking very nice since it is at 80% showing that the company does not have the ability to repay its short term liabilities with the current assets that are currently in possession.’ said Antreas Themistokleous at Exness. ‘The dividend yield however of over 2.5% and the payout ratio of more than 70% make the share price of the beverage giant an attractive addition to investors portfolios’
From the technical analysis perspective the price has been trading in strong bullish momentum testing the upper band of the Bollinger bands for a period of two weeks. This shows that there was high volatility in the market while at the same time the 50 SMA is on the move to cross above the 100 SMA in the coming sessions further validating the bullish trend in the market.
Although the overall movement for the price is bullish there are still some signs of a correction since the Stochastic oscillator has been recording overbought levels for the past month. In such a case we might see some support around the HKEX:182 price area which consists of the 20 day moving average and the 78.6% of the weekly Fibonacci retracement level.

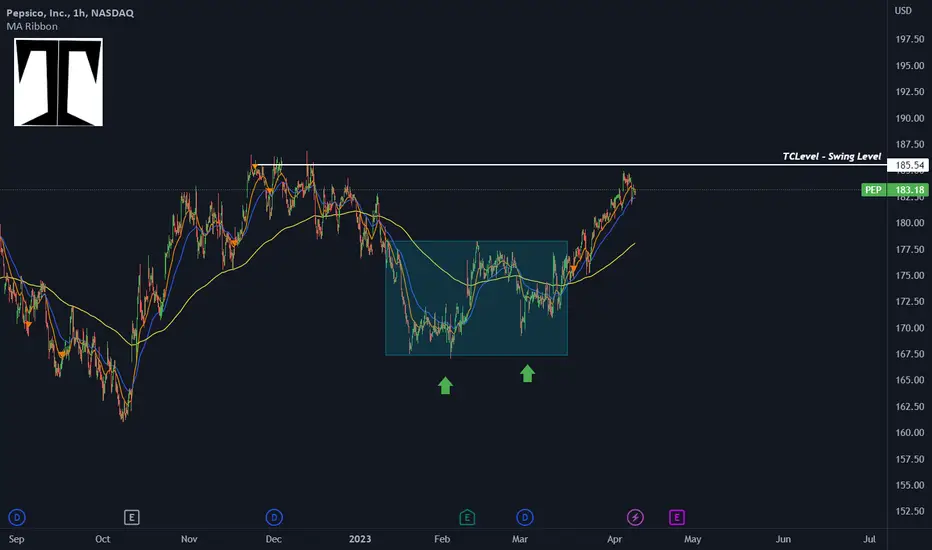
Swing Update : PEPThe price already moved out of the box with positive price action.
The ema 50h is supporting the price.
The next level is at 185.5.
PEPSI DAILY XABCD CRABPEPSI DAILY
HARMONIC CRAB
Projection till D: 199
Point B is broken
EP: 182
TP:195
SL: 169
Look for diversion after TP

PEP - BULLISH SCENARIOPepsiCo reported revenues of $28 billion in the last reported quarter, representing a year-over-year change of +10.9%. EPS of $1.67 for the same period compares with $1.53 a year ago.
The strength centered on the Frito-Lay North America business grew by 25%.
The uptrend remains strong, and the price is heading to the upper part of the channel, the $ 195 resistance level
Risk Disclosure: Trading Foreign Exchange (Forex) and Contracts of Difference (CFD's) carries a high level of risk. By registering and signing up, any client affirms their understanding of their own personal accountability for all transactions performed within their account and recognizes the risks associated with trading on such markets and on such sites. Furthermore, one understands that the company carries zero influence over transactions, markets, and trading signals, therefore, cannot be held liable nor guarantee any profits or losses.

sell signal in Pepsico
Pepsi co is showing top of the current swing, and last candle formed is Gravestone Doji.
Combine both shows it going down in near future

$PEP with a bullish outlook following its earnings #StocksThe PEAD projected a bullish outlook for $PEP after a Negative over reaction following its earnings release placing the stock in drift C with an expected accuracy of 50%.

PEP AnalysisPrice has mitigated the bullish POI at 160.98 and broke minor market structure to the upside. Price has built buy-side liquidity from late December 2022 to early January 2023. 2 scenarios that could happen here. 1) Price could potentially going higher to take out the buy-side liquidity first then drop lower to fill the fair value gap at 166.60. 2) Price filling fair value gap below, continuing with the bearish order flow lower.
PEPSICO - ChannelPEPSI released earnings today and announced a 10% increase in its dividend. The stock is trading within a large rising channel.
The MACD is turning up and a swing to the top of the range is possible here.
Bulls are in control while we trade above $166 (Daily close)

Pepsi Ahead of earningsPepsi reports earnings tomorrow morning.
Based off the bearish consolidation, its looking likely that Pepsi can fall lower on maybe a bad earnings or weak forward guidance.
The trading play that we are watching is a gap down into support and then buying Pepsi as a long. This will be a day trading level we will be looking for.

Pep Setup for Long CallPep 1H Setup for Long Call
1- Trend is bullish
2- price is currently on HL
3- Double Bottom can be observed
4- Call for Long
Entry: 170
SL:166
TP: 177 ( Can be trailed till 184)
RRR: 1:2 or 1:4

PEP PepsiCo Options Ahead Of EarningsIf you haven`t bought PEP after my last call:
Then you should know that looking at the PEP PepsiCo options chain ahead of earnings , I would buy the $165 strike price Puts with
2023-2-17 expiration date for about
$1.83 premium.
If the options turn out to be profitable Before the earnings release, I would sell at least 50%.
Looking forward to read your opinion about it.

PEPSI - Ascending channel patternThe price is moving up in a ascending channel, that has reached its bottom, so I expect a rebound.
D1:
Good trading!
If you find it useful, like, follow, share!

Pepsi Time CyclePrice is oscillating in a cyclical manner within a sweeping channel. If it continues to do so, it will be at $193 by March 20th. Keyword: if. It might make sense to pick up a couple calls just in case, they’re fairly cheap. Also, entering long here with a stop outside the channel might make sense as well.

PEP - bear flag or range lows?NASDAQ:PEP
How would you approach this? Would you short it at a breakdown or look to go long until the range highs?

Pepsico long wedge patternThe algorithm has found a wedge in pepsico which gives a great risk return ratio.
Good luck and take care with the red line, where a multiple top pattern could be formed even when the target of the wedge is over it.

#PEP short ideaHello dear Traders,
Here is my idea for #PEP
Price closed below yellow line (previous month low)
Targets marked in the chart (green lines)
Invalidation level marked with red line
Good luck!
❤️Please feel free to ask any question in comments. I will try to answer all! Thank you.
Please, support my work with like, thank you!❤️
