retest of $100 probably coming soonSupport seems firm at $80. I'm looking for a test of the big round number of $100, could go higher, but as a trade this seems like a likely target.
PLTR trade ideas


Quantum's PLTR Trading GuideSentiment: Bullish. AI and government contract hype drives enthusiasm, though valuation risks noted. Chatter lean bullish, citing growth momentum.
Outlook: Neutral, slightly bearish. Options pin $88, with $85 puts active. ICT/SMT eyes $86-$88 buys to $92 if $86 holds. Bearish below $86 risks $80.
Influential News:
Federal Reserve: Two 2025 cuts aid growth stocks, positive for $PLTR.
Earnings: Q1 due early May; no update today.
Chatter: Bullish on AI/contracts, some warn of pullback.
Mergers and Acquisitions (M&A): No confirmed NASDAQ:PLTR M&A; partnership expansions rumored.
Other: Tariff volatility hit tech; NASDAQ:PLTR resilient.
Indicators:
Weekly:
RSI: ~75 (overbought).
Stochastic: ~85 (overbought).
MFI: ~80 (overbought).
SMAs: 10-day ~$86 (above, bullish), 20-day ~$85 (above, bullish).
Interpretation: Overbought, bullish SMAs suggest pullback risk.
Daily:
RSI: ~72 (overbought).
Stochastic: ~80 (overbought).
MFI: ~75 (overbought).
SMAs: 10-day ~$86 (above, bullish), 20-day ~$85 (above, bullish).
Interpretation: Overbought, bullish SMAs but caution warranted.
Hourly:
RSI: ~70 (neutral).
Stochastic: ~75 (overbought).
MFI: ~70 (neutral).
SMAs: 10-day ~$86 (above, bullish), 20-day ~$85 (above, bullish).
Interpretation: Overbought, bullish momentum fading.
Price Context: $88.55, 1M: +2%, 1Y: +303%. Range $80-$92, testing $88 resistance.
Options Positioning (May 2025):
Volume:
Calls: $90 (10,000, 60% ask), $95 (8,000, 55% ask). Bullish bets on $90+.
Puts: $85 (7,000, 70% bid), $80 (5,000, 65% bid). Put buying grows.
Open Interest:
Calls: $90 (30,000, +5,000), $95 (20,000, +4,000). Bullish positions.
Puts: $85 (18,000, +3,000), $80 (15,000, +2,000). Hedging. Put-call ~0.7.
IV Skew:
Calls: $90 (45%), $95 (47%, up 3%). $95 IV rise shows upside bets.
Puts: $85 (40%, up 2%), $80 (38%). Rising $85 IV signals downside fear.
Probability: 60% $80-$92, 20% <$80.
Karsan’s Interpretation:
Vanna: Positive (~200k shares/1% IV). IV drop could pressure $88.
Charm: Positive (~100k shares/day). Pins $88.
GEX: +80,000. Caps upside.
DEX: +4M shares, bullish.
Karsan view: High GEX limits $92+; pullback to $85 likely.
ICT/SMT Analysis:
Weekly: Bearish at $88 OB, targets $85. Bullish > $92.
Daily: Bearish at $88 FVG, targets $85. Bullish > $90.
1-Hour: Bearish < $88, $85 target. MSS at $90.
10-Minute: OTE ($87-$88.50, $87.75) for sells, NY AM.
Trade Idea:
Bullish: 45%. ICT/SMT buys $86-$88 to $92. Options favor $90 calls. AI hype supports.
Neutral: 30%. $80-$92 range, balanced options.
Bearish: 25%. Below $85 likely with overbought signals. $85 put volume rises.

PLTR Tightening in the Apex – Breakout Imminent?Technical Analysis (1H Chart)
PLTR has been coiling tightly within a symmetrical triangle, pressing into the apex, with price currently hovering around $88.50. It rejected higher highs after touching $93.32, showing signs of compression between trendlines.
* Trendlines: A descending resistance from the FWB:93S and an ascending support from the GETTEX:73S have been holding firm.
* Current Price: $88.54 (Ask), right at a confluence zone.
* Support Zones:
* First support: $84.26 (mid-range support).
* Second support: $73.79 (prior base breakout zone).
* Resistance Zones:
* First resistance: $90.07 (local top).
* Second resistance: $93.32 (breakout pivot).
🧭 RSI is flatlining near 50 — a classic equilibrium in a triangle squeeze. Volume is fading, which is normal before a breakout.
Options GEX Analysis
PLTR's GEX map is one of the most balanced of the group — but it’s sitting right on a Gamma Wall at $88 with serious implications.
* Gamma Wall (Resistance): $88.00 – Highest NET GEX zone, making it a tough ceiling unless there's volume acceleration.
* Key CALL Walls:
* $90 – Moderate resistance (40.7% GEX7)
* $93 – Larger resistance (78.84% at 2nd CALL Wall)
* $100+ – Overhead gamma unwind potential if breakout occurs.
* Key PUT Walls:
* $84 – Weak PUT support.
* $75 – Stronger defensive gamma zone.
* $70 – Ultimate protection (3rd PUT Wall).
📊 Options Sentiment:
* IVR: 80.4 (Very High – traders are betting on volatility)
* IVx avg: 102.2
* Call Flow: 27.8% bullish
* Signal: ✅🟢🟢 (Moderate bullish with gamma support)
Trade Ideas
🔼 Bullish Scenario (If price breaks $90):
* Entry: Above $90.10 breakout candle with volume
* Target 1: $93.33
* Target 2: $95–100 gamma chase if volume surges
* Stop: Below $86.50 (below ascending trendline)
🔽 Bearish Scenario (If it breaks below $84):
* Entry: Below $84 breakdown zone
* Target 1: $80 zone
* Target 2: $75 strong PUT wall
* Stop: Above $88 zone
💭 My Thoughts:
PLTR is coiling for a breakout. The gamma wall at $88 is acting like a magnet, but it can't hold forever. With high IVR and a massive buildup around $90–93, the next breakout could be fast and aggressive. If bulls take control above $90, it could ignite a squeeze into $95+. On the flip side, if it slips under $84, we could revisit $75 quickly.
📉 This analysis is for educational purposes only and does not constitute financial advice. Always do your own due diligence and manage your risk properly.

Focus names for this week $PLTR $IONQ $BROS $FTNT $OKLO etcWatchlist for this week. Most have two tight days and higher lows
Above $20, ADR of 3%+:
NASDAQ:PLTR NYSE:IONQ NYSE:BROS NASDAQ:FTNT NYSE:OKLO NYSE:RBRK NYSE:TOST NYSE:SNOW
Below $20, ADR of 3%+:
NASDAQ:RKLB NYSE:QBTS
Thematic:
NASDAQ:AAPL NASDAQ:AAPU NASDAQ:NVDA NASDAQ:NVDL AMEX:SOXL

$NASDAQ:PLTR Bearish ThesisNote: Testing the Supply and Demand Basis for Trading
Based on the 1-d chart, the recent bullish move following Trump's tweet has not yet broken through the Supply Zone. Expected pullback back to Demand Zone. Reward/Risk Ratio = 2.78 using these zone.
If another bull-run breaks past Supply Zone will close short position and wait until bounce from ATH Supply Zone to re-enter.

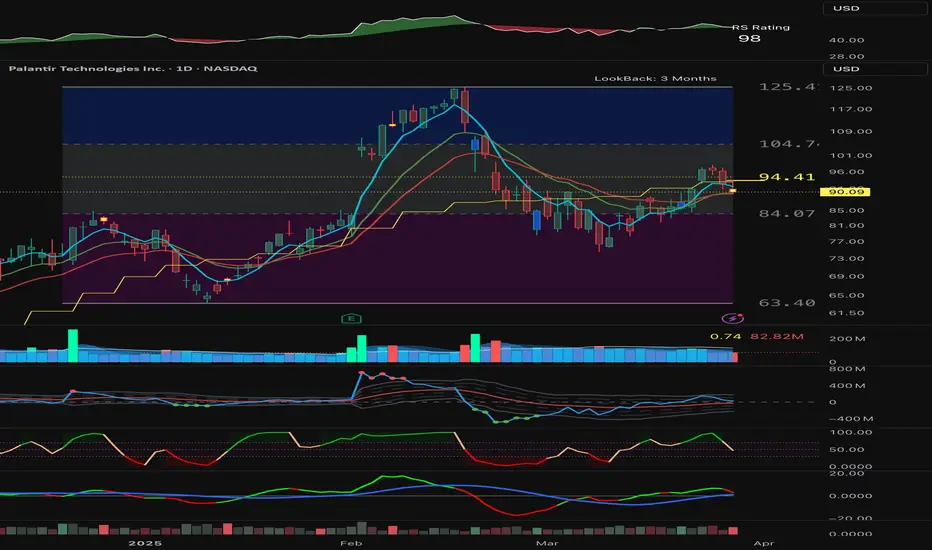
PALANTIR. THE STOCK THAT BEATS S&P 500 INDEX, 11 MONTHS IN A ROWSomewhere in another Galaxy, in late December, 2024 (yet before The Second Coming of Trump), @TradingView asked at it awesome Giveaway: Happy Holidays & Merry Christmas!
1️⃣ What was your best trade this year?
2️⃣ What is your trading goal for 2025?
Here's what we answered:
1️⃣ What was your best trade this year?
- Surely Palantir NASDAQ:PLTR 💖
I followed Palantir all the year since January, 2024, from $16 per share, watch here.
Current result is 5X, to $80 per share.
Also I added more Palantir after SP500 Index inclusion in September 2024 watch here.
Current result is 2.6X, from $30 to $80 per share.
2️⃣ What is your trading goal for 2025?
- Once again, surely Palantir NASDAQ:PLTR 💖
It's gone three months and a half or so... (Duh..? Haha.. 3 months, really? 😸😸😸)
Let see what's happened next at the main graph PLTR/SPX
First of all, let me explain in a few words what does this graph mean.
Rising (Blue) candle means Palantir NASDAQ:PLTR monthly return is better vs SP:SPX
Falling (Red) candle means Palantir NASDAQ:PLTR monthly return is worse then SP:SPX
Conclusion
👌 PALANTIR. THE STOCK THAT OUTPERFORMS S&P 500, 11 MONTHS IN A ROW.
👌 WERE WE RIGHT ON CONTEST AND WON IT? EXACTLY!
--
Best wishes,
Your Beloved @PandorraResearch Team 😎

PLTRPublished an idea the other day showing PLTR In a trend channel that was clean.
Looking like a clean break out of that channel signaling potential BULL MOMENTUM as the US market recovers from the FUD over the last week.
A close and hold above $86 to end the week would get me to consider a DCA entry beginning Monday.
For now I wait
Research: Retracement VS Exponential GridIn this research idea I'll test which of those two tools would be a more effective way for projecting future key levels to which price may react best.
While both of them are chart-based and run on fibonacci with progression rate 0.25 showing exponential spacing between levels, there are differences:
TradingView's Fibonacci Retracement (2 chart points)
Levels are derived from distance 0-1 which measures the -86% decline.
Exponential Grid (1 chart point)
Levels are derived just from the historic lowest price.
Historically, in both cases price movements have respected these exponential levels.
This experiment is essential for various reasons:
Understanding better parabolic growth patterns.
Improving the indicator for a better performance and user experience.
ENDGOAL
Accurately map support, resistance, and market reactions ensuring better predictive accuracy for future price action.

Palantir Technologies (PLTR) - Bearish IdeaPalantir is currently breaking down from a clear distribution pattern, failing to reclaim previous highs and showing signs of a macro-driven top. The chart highlights a series of lower highs, breakdown of rising trendline support premarket, and increasing downside momentum.
From a fundamental standpoint, Palantir is still trading at an exceptionally high valuation:
P/E (TTM): ~350
Forward P/E: ~130
Valuation far exceeds even the average Nasdaq tech stock
In the context of a shifting macro environment:
Trade war escalations and tariffs are increasing pressure on the tech sector, particularly AI-driven companies like Palantir that depend on high-performance chips.
Rising inflation risk, combined with persistent interest rates, is likely to continue pushing investor sentiment away from overvalued growth stocks.
Broader market rotation from risk-on to risk-off suggests capital will exit speculative names.
From a technical perspective:
Trendline support has broken premarket
There is a deeper demand zone between $14–18, which coincides with volume shelf and pre-hype accumulation range
This is not a call for an immediate collapse, but rather the beginning of a macro-level revaluation process. Short-term bounces are to be expected, but the overall trend appears to be decisively down unless strong macro or fundamental catalysts reappear.
Target zone: $14–18
Stop invalidation: Weekly close above $103
---
Disclaimer: This is not financial advice. The content reflects a personal market view and is intended for educational purposes only. Always conduct your own research and consult with a licensed financial advisor before making any investment decisions.

Are the buyers back in the game?It seems that we have a Wycoff spring in hands. Buyers seem strong in that level and it could push the stock higher.

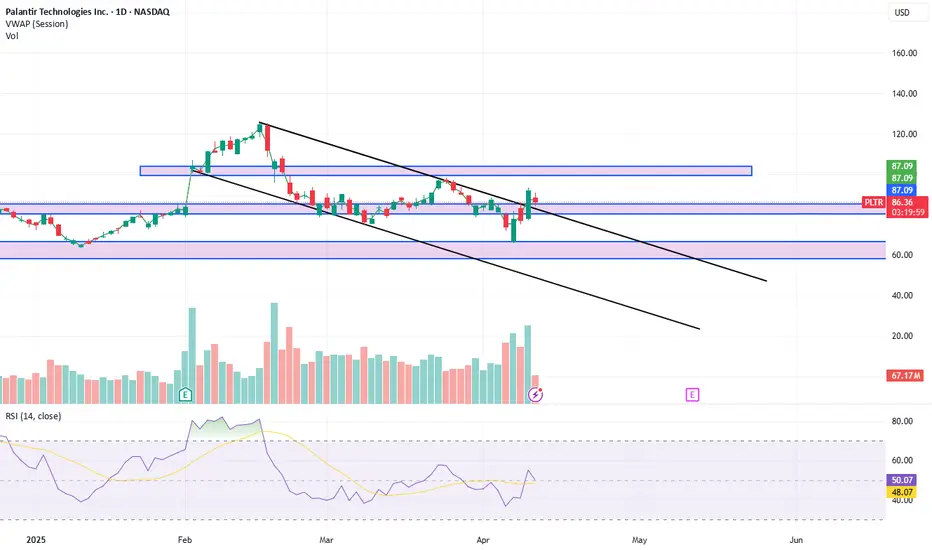
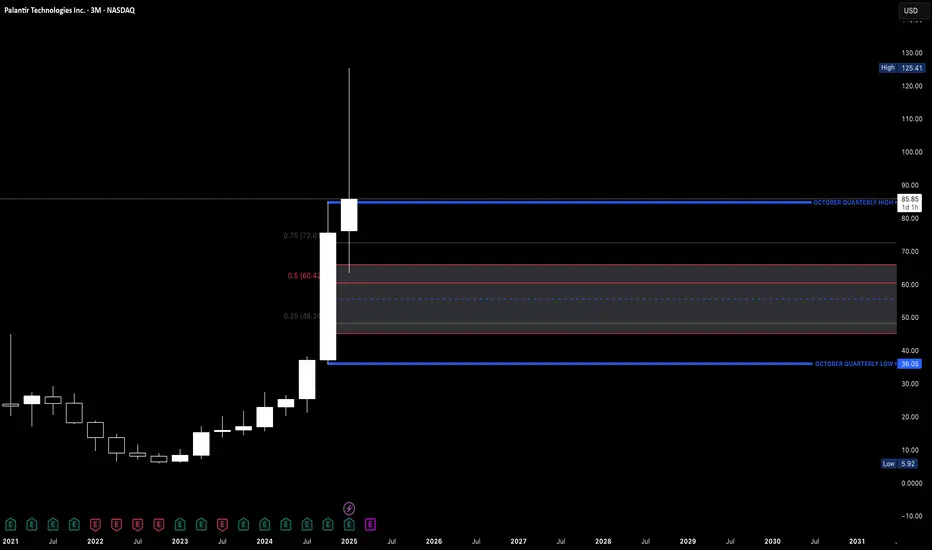
$PLTR will see $36.05 in the next 3 monthsNASDAQ:PLTR
Based on my analysis, we are one day away from the close of the January quarterly candle, it is clear that it will close in the form of a Topping tail. In the last three months we have witnessed heavy manipulation in this stock to accumulate as much optimism in this stock as possible. With such a Long top wicked candle, usually the distribution candle which will open on the 1st of April, has an aggressive push to the opposite side of the range.
The lower end of the range is $36.05 and the mid point is $60.42. $60.42 is partials on profits and full profits can be taken at the Target low of $36.05.
I have already started to accumulate Longs on puts at $50 strike at a pretty good price($0.03-$0.05), end of April expiry, when this established its latest intermediate high at around $99.00.
I will continue to accumulate puts as well as date stagger them between 20-60 day ranges. This is to accumulate cash on the incoming projected down period in markets. This company is one of the glaring few that presents good vertical price movement due to incredibly high valuations.
None of this is trading advice, however, trade how you see fit.
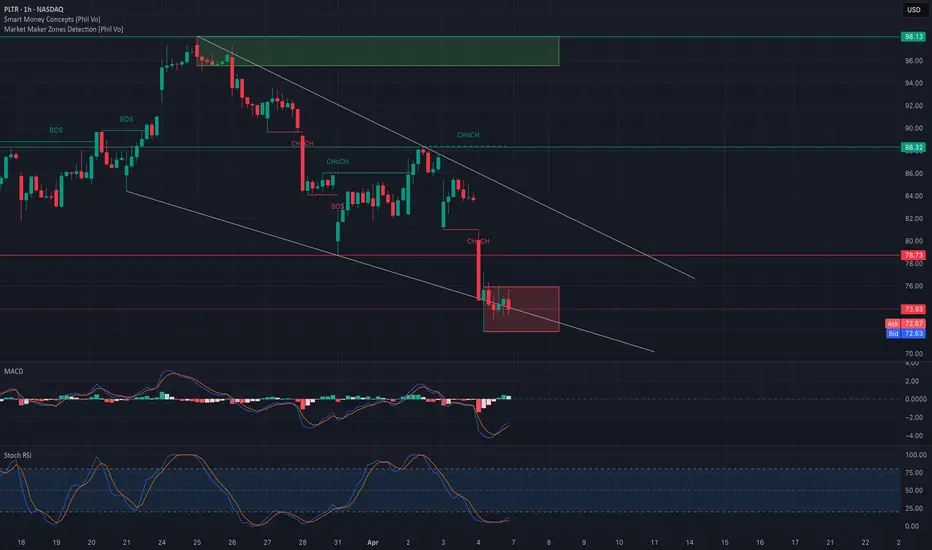
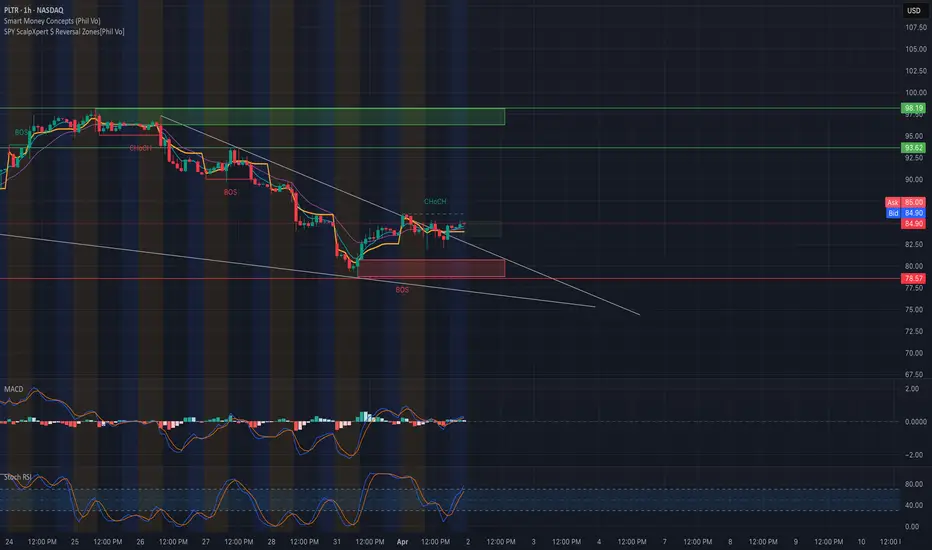
PLTR Is Testing a Critical Breakdown Zone – S M Might Be WatchinPLTR Is Testing a Critical Breakdown Zone – Smart Money Might Be Watching This 👀
Technical Analysis & Trading Insights
PLTR has broken down from its rising channel and is now consolidating tightly around the $72–74 area. This zone represents a key point of interest where price is reacting along the lower bound of the descending wedge. Smart Money Concepts (SMC) show a clear Break of Structure (BOS) followed by CHoCH attempts that were swiftly rejected.
* Market Structure: We're in a strong bearish downtrend within a descending wedge. Current price action is hovering around a previous liquidity grab zone.
* MACD: While still below the signal line, histogram bars are showing slight momentum loss to the downside – suggesting early signs of buyer defense.
* Stochastic RSI: Deep in the oversold zone, curling upward – a classic signal for potential bounce or relief rally.
This confluence of compression inside a wedge, oversold momentum, and price hovering just above PUT support creates an interesting risk-reward scenario.
GEX & Options Sentiment
* Highest Negative GEX / PUT Wall: $70 – This is the strongest magnet for sellers and likely where dealers may flip.
* Massive Call$ Activity: A massive 134.4% call-dollar inflow indicates bullish options positioning, likely hedging or prepping for a reversal.
* IVR is at 130.4, and IVx average is 138.1, reflecting extreme implied volatility. This means premiums are high and markets are expecting big moves.
* Support Zones (Gamma Walls): $70 serves as the strongest gamma support.
* Resistance Zones: $83 to $90 is a heavy resistance area. If we get above $78.73 (local BOS resistance), $83 could be next.
Scenarios to Watch
Bullish Reversal Setup:
* A reclaim above $74 and breakout of the wedge could trigger a rally to $78.73 (BOS), then $83 (Gamma Wall).
* Watch for MACD crossover and RSI break above 20 as confirmation.
* Conservative entry: Wait for a retest of $74 as support.
Bearish Breakdown Setup:
* If $72 breaks with volume, price could rush to test the $70 PUT Wall.
* Breakdown below $70 could accelerate toward $65, with volume-driven stops getting triggered.
Thoughts for Investors & Traders
The macro backdrop is still shaky after the tariff-triggered selloff. PLTR, like many tech stocks, is in an oversold state but faces overhead gamma resistance and dealer hedging pressure. The safest approach for longer-term investors may be waiting for weekly structure to stabilize above $83, where demand zones and bullish structure will reassert.
For short-term traders, this is a classic liquidity sweep + reversal setup, but it needs confirmation. Use tight stops and avoid chasing.
Disclaimer:
This analysis is for educational purposes only and does not constitute financial advice. Always conduct your own research and manage risk responsibly.
Opening (IRA): PLTR May 17th 100 Covered Call... for a 86.55 debit.
Comments: After closing out my long-dated covered call for a realized gain, re-upping with a shorter duration setup with a max profit potential of greater than 11.18, which is what I'm net down on this underlying YTD.
Metrics:
Buying Power Effect/Break Even: 86.55
Max Profit: 13.45
Will look to roll out the short call at 50% max to reduce my break even.

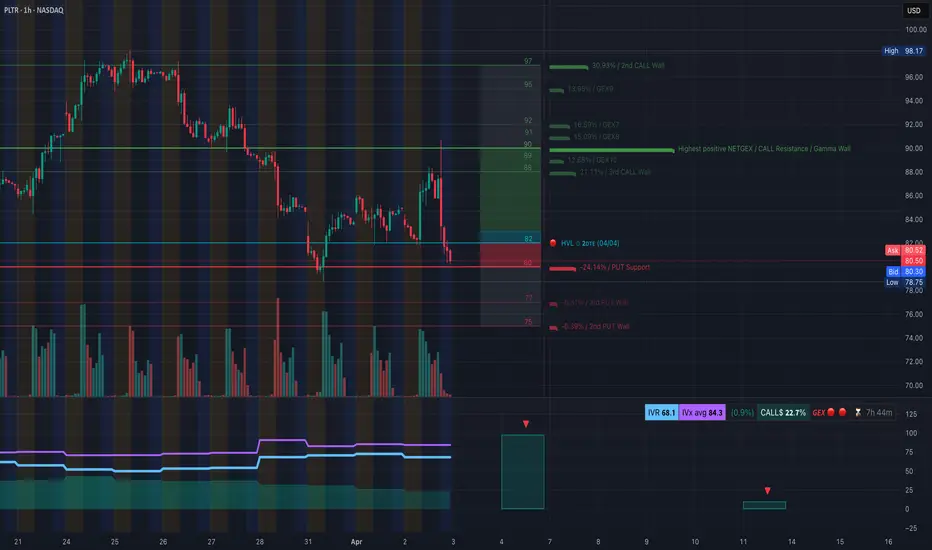
PLTR Hovering at $80 Support: Will This Zone Absorb the Panic?
📉 Market Context:
In the aftermath of the Trump tariff-driven market crash, PLTR is teetering at critical gamma + price support around $80.30. The question now: is this a trap door breakdown or a gamma bounce setup into OPEX week?
📊 Technical Analysis (1H Chart)
Structure & Price Action:
* PLTR’s short-term rally toward $91 was rejected at the GEX resistance zone.
* Sharp breakdown back to $80 confirms this is a contested liquidity zone.
* Current price sits at a red HVL zone, overlapping the PUT Support from options flow.
Key Levels:
* Support:
* 🔻 $80.30–80.00: Major liquidity shelf & highest PUT support
* 🔻 $77 / $75 = deeper gamma cliffs if $80 fails
* Resistance:
* 🔺 $82 = HVL reclaim needed to flip short-term trend
* 🔺 $88–$91 = Gamma Resistance & supply zone
* 🔺 $93–$97 = OTM CALL targets, low odds unless squeeze begins
Indicators:
* Volume spiking on sell candles, confirming the flush.
* No bullish divergence visible yet on lower timeframes.
* Still no structure signaling reversal — watching $80 reaction closely.
🧨 GEX + Options Sentiment
GEX Insight (Options GEX ):
* GEX Sentiment: 🔴🔴🔴 → deep in short gamma territory; dealers may hedge against bounces.
* $80 = Highest negative NET GEX and PUT wall — this level is critical.
* Below $80 → dealer gamma unwinding could accelerate → volatility spike.
* Above $82 → could set up a fast magnet move to $88 if momentum shifts.
Options Oscillator:
* IVR 68.1 / IVx avg 84.3 → still relatively high, room for volatility to contract.
* CALL$ 22.7% → moderate call buyers, but no clear signal of squeeze intent.
* Time decay visible with large bets expiring in next 2 sessions.
🧭 Trade Scenarios
🐻 Breakdown Play:
* Trigger: Candle close under $80.00
* Target: $77 → $75 (gamma void zone)
* Stop: Above $82.00
* Notes: High odds for 0DTE / 2DTE PUTs on a weak open
🐂 Bounce from Gamma Support:
* Trigger: $80 holds + reclaim $82 HVL with volume
* Target: $88–$91 for gamma mean-reversion play
* Stop: Below $79
* Ideal: Buy 0DTE/2DTE FWB:85C or debit spread targeting quick rebound
🎯 Summary:
PLTR is sitting on the edge of a gamma shelf. $80 is the line between bounce and bleed. GEX shows this is the max pain zone. Bulls need to defend this level aggressively, or we open up for a potential flush to $75 with heavy dealer hedging in play.
⚔️ Suggested Trade:
* 🔻 $80P 0DTE if market gaps below $80
* 🔺 FWB:85C 2DTE only after $82 reclaim with strong volume
* 🎯 Scalpers can use $82/$88 as pivot zones
Disclaimer: This breakdown is for educational purposes. Please trade based on your risk management and setup rules.
[bearish] a quick PLTR short trade- NASDAQ bearish
- PLTR overvalued.
- PLTR broke recent supports.
- Downside reward >> upside risk.
- TP1: 66, TP2(if you're feeling lucky): 42.
- SL: 98.
- R:/R: 1.76 to 3.95
- Note: graph has a 3 day timeframe as bigboi PLTR here likes to be a loud noisy fucker on the daily.

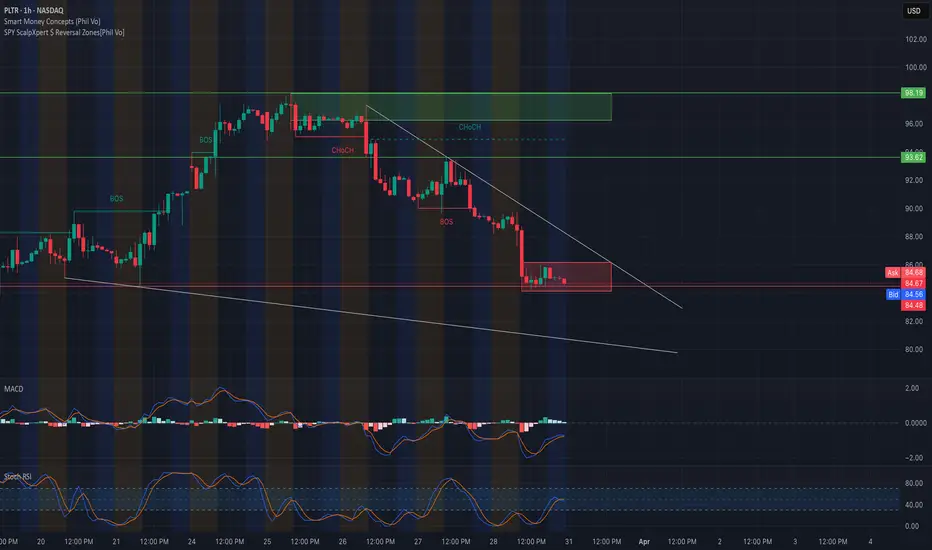
PLTR Building Momentum Inside a Wedge — Breakout Imminent? 🔥
1. Market Structure & Price Action
PLTR is compressing inside a descending wedge while forming a small CHoCH near $85, attempting to flip structure.
We saw a BOS from the $80 region, pushing toward the $85 liquidity zone. Price is consolidating under a key resistance band around $86, just below the GEX HVL level.
2. SMC & Supply/Demand Zones
* Demand Zone: $78–$80 range acted as a BOS origin with high buyer reaction.
* Supply Zone: $85–$86 now tested multiple times.
* Downward trendline resistance is holding; a break above could invite a run toward the $90 zone.
3. Indicators Analysis
* MACD: Slightly bullish crossover, histogram fading — suggesting early momentum but caution.
* Stoch RSI: Rebounding from oversold, trending upward toward 80 — suggests bullish follow-through if resistance breaks.
4. Options Sentiment & GEX
* GEX Chart shows a thick CALL Resistance / Gamma Wall at $90, aligned with the second call wall (29.31%).
* HVL at $86: Major short-term magnet — breakout above could initiate a gamma squeeze.
* Put support: Strongest level sits at $80, where downside is well-hedged.
* Options Oscillator:
* IVR: 72.4
* IVx Avg: 85.2
* Call$: 26.1%
* GEX Sentiment: 🟢🟢🔴 — still slightly conflicted, but flipping green.
5. Bullish Scenario 🟢
* Entry: Break and retest of $86 with volume
* Target 1: $90 (Gamma Wall)
* Target 2: $93.5–$95
* Stop-loss: Below $83
6. Bearish Scenario 🔴
* Entry: Rejection from $86 + drop under $83
* Target 1: $80
* Target 2: $78–$77 PUT wall
* Stop-loss: Above $86.5
Conclusion
PLTR is sitting at a critical inflection point. Compression inside a wedge, early CHoCH + GEX alignment suggests breakout potential, but the $86 HVL must be cleared first. Watch volume and MACD confirmation for the next move.
Disclaimer: This analysis is for educational purposes only and does not constitute financial advice. Always do your own research and manage your risk.
PLTRI believe NASDAQ:PLTR is in a wave C correction and will go down more from here.
Possible fall back to $40 region?

PLTR Showing Weakness Near Key Support: Rebound or Breakdown?🔍 Market Structure & Price Action (1H)
* Trend: Bearish structure confirmed. PLTR has broken previous bullish BOS (Break of Structure) and is forming lower highs and lower lows.
* Current Zone: Price is consolidating in a tight red Reversal Zone near ~$84.50, showing buyer hesitation.
* Descending Channel: PLTR is respecting a well-defined descending wedge. A breakout above the upper trendline (around $86–87) is needed to confirm bullish momentum.
* S/R Levels:
* Immediate Resistance: $86.50–87.00
* Key Support: $84.00, then strong structure at $80.00.
📈 Indicators
* MACD: Momentum is flat, histogram bars weakening—indecision or early sign of reversal.
* Stoch RSI: Curving upward from the oversold region, potential short-term bounce if volume confirms.
🧠 Smart Money Concepts (SMC)
* CHoCH (Change of Character): Bearish CHoCH already occurred, confirming shift in bias.
* BOS (Break of Structure): Multiple BOS reinforce downward trend.
* Liquidity Sweep: Price hovering near potential liquidity zones (below $84), suggesting big players might be hunting stops before reversal or breakdown.
📊 Options GEX + Sentiment (Options GEX )
* IVR: 68.2 (relatively elevated, implies decent premium selling opportunities)
* IVx avg: 90.7, shows heightened volatility priced in.
* Call$/Put$ Flow:
* Calls: 31.6%
* GEX Sentiment: 🔴🔴🔴 (3 Red Dots = Bearish)
* Gamma Exposure (GEX):
* Highest negative GEX zone (PUT wall support): $80.00 → strong magnet if breakdown continues.
* Moderate Put wall: $84.00
* Strongest Call Resistance / Gamma Wall: $92.00–$98.00 (above the descending channel)
* HVL: $85.83 → Heavy volume level, confluence zone for key decisions.
⚔️ Trade Scenarios
🟢 Bullish Reversal Scenario
* Entry: Break above $86 with bullish volume
* Target: $89 → $92 (short-term), then $98 if momentum builds
* Stop-Loss: Below $83.50
* Options Play: Buy Calls 2–3 weeks out ATM ( FWB:85C or $87C) or credit put spreads around $80–$82
🔴 Bearish Breakdown Scenario
* Entry: Break below $84 support with volume
* Target: $82 → $80 (major GEX support)
* Stop-Loss: Above $86
* Options Play: Buy Puts ( GETTEX:82P or $80P), or bear call spreads under $90
📌 Conclusion
PLTR is at a make-or-break zone near strong support. If it holds $84 and breaks the trendline, a short-term relief rally toward $92–$98 is possible. However, if $84 gives way, the GEX-supported magnet at $80 could be the next stop. Watch volume and MACD crossover for early clues.
Disclaimer: This analysis is for educational purposes only and does not constitute financial advice. Always do your own research and manage your risk.
PLTR.. 50.00 inboundLogarithmic chart for the parabolic move
White trendlines - Ascending broadening wedge (Bearish)
Yellow trendline - Primary trend and final target
Looking for a H&S play out here on PLTR for the next 2 quarter.. I don't think this stock ever breaks back over 100.00 this year!
The head is forming now and will be completed at 63.00.. then comes the right shoulder...
The top is in , the rest of these moves are distribution

Entry never triggered todayThe setup never triggered today and also confirmed why I passed on the trade yesterday. the odds of taking positions when the Nasdaq is on a sell signal are not good.

$PLTR First PB Buy SetupIt will trigger just above the Inv Hammer Candle, with the Nasdaq on a buy signal it would be a no brainer. Today I will let it go and pass.
Pullback Continuation PLTR After hit first target 97, now has offereda a pullback to the key 90 level
Indicators showing good potential, momentum, sttregnt, directional.
Part of a market idea
