nice play for longs recently! 🚀 blasted through previous long trigger, congrats if you caught the move! watching for break of 105.18 for continuation to upside, break below 94.07 for potential shorts
PYPL trade ideas

85-90 neartermGap fill down incoming, triple top, expanded flat c incoming, at resistance, wave 5 now needs corrective wave.... all things near-term bearish load puts

PYPL into the 100s. Forget about it.The SP500 runs into some resistance around 4260 to 4300.
Technically above 4200 is my supply zone but from how we are setting up / how far down some of these quality names got dumped
PYPL still has room to run into 112 to 116 this month
This trade is invalid if PYPL cannot hold 93.61 I would not be interested in that move

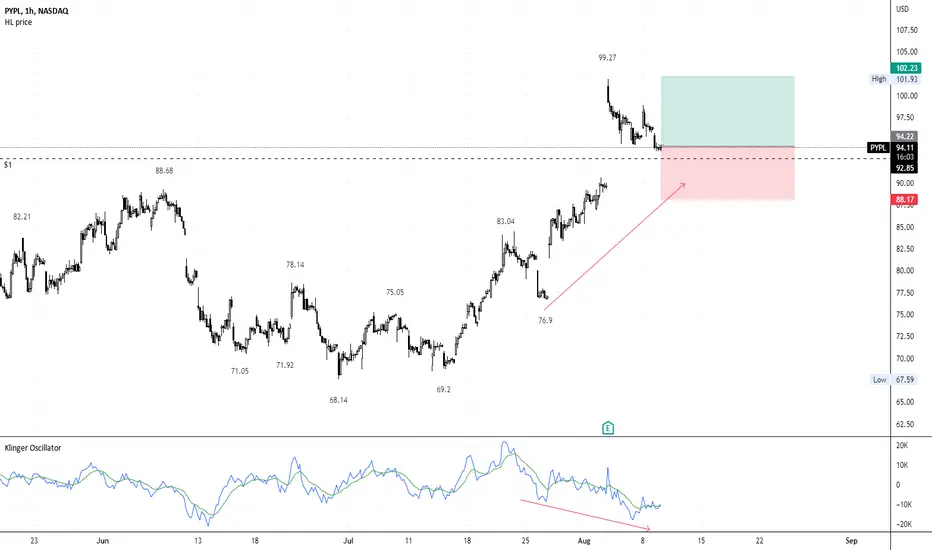
LONG PYPL @94.22 Bullish DivergenceLONG PYPL @94.22
Klinger Oscillator (Bullish Divergence) 1H + 4H
RR1.32
gap support
#week09assignment
$PYPL with a Bullish outlook following its earnings #Stocks The PEAD projected a Bullish outlook for $PYPL after a Positive over reaction following its earnings release placing the stock in drift B with an expected accuracy of 75%.
PYPL - Another opportunity in sight!After a more than welcome earnings rally, we would like to give investors an insight on paypal! NASDAQ:PYPL
In the past, we published several articles about paypal and announced our first acquisition back at 102,87$.
We highlighted our price targets and warned about a possible alternative which would push the price down to at least 70$.
Due to the overall weakness in most tech stocks paypal suffered further losses too and our alternative scenario came true.
However, the last weeks give reason for new optimism and most tech stocks gained double digits.
Furthermore the earnings report of paypal eased the tension most investors are feeling and the confidence in this company seems to return once more.
The immense growth of the covid-19 rally may not return in full strength but the concerns around slower growth is now priced in by the market.
According to our analysis, we expect that a 1-2 setup will form in the next days and will give everyone another opportunity to open further positions.
The chart structure of which this wave 1 consists points towards a bullish structure and formed five clear impulsive waves.
Investors and traders should expect an a-b-c correction to at least 85$ and we will announce further long positions in the marked green zone.
We advise everyone to watch paypal closely in the next few weeks, this effort will certainly be rewarded in the future
Our long-term chart which we published for the first time back in February is still valid and many indicators are recovering or reporting a bullish reversal.
Keep in mind that this chart is heavily simplified and a detailed analysis about every wave count can be found in the analysis above.
Paypal is severely undervalued and we believe that prices below 100$ are very good for accumulating.
Long #1 Paypal (NASDAQ:PYPL)
AVERAGE EXECUTION PRICE: 102.87$
STOP-LOSS: NONE
LONGTERM-TARGET: +200$ / +300$


Why PayPal ( $PYPL) is one of my TOP long call "position trades"Why I like PayPal PYPL
Back to 2017 levels, pretty much "recession proof" (give or take). It's almost God sent being down at these levels (undervalued/fair value). There are some strikes that are def. set up for nicely profitable positions if chosen correctly, common shares as well. Though I hid a lot of my indicators for a simple view, there is def. a divergence between price and RSI on both the Daily & Weekly, as well as the Monthly looking pretty bottomed out. I am pretty big into Harmonic patterns , but am not going to share my "secret sauce", at this current time.
I will continue to add to my position and average down (as planned) into further out strike dates. I as well will MOST LIKELY play the short term trends as well, but my overall goal is to see at least $115.00 with my "position trade" call contracts.
I typically leaves these "ideas" pretty brief on Trading View as I don't really have a BIG following on here
If you have any questions about my "idea" feel free to reach out!
(This is a repost as I had some community violations I was unaware about)

Paypal pumpWith positive Earnings Payapl is already + 10% in after-hours breaking the 92.57 resistance...the retest of this line turned support could be a good entry for a long ap around the 120 $ where there's strong resistance from the 200 MA as well. I would take some profit if you are a trader and not an investor, Also the structure from April till now seems like a bottom to me.

$PYPL for augustTime to enter = Now.
Anything under $85/share is good. Low 80s is even better.
Hold for 30-60 days and sell.

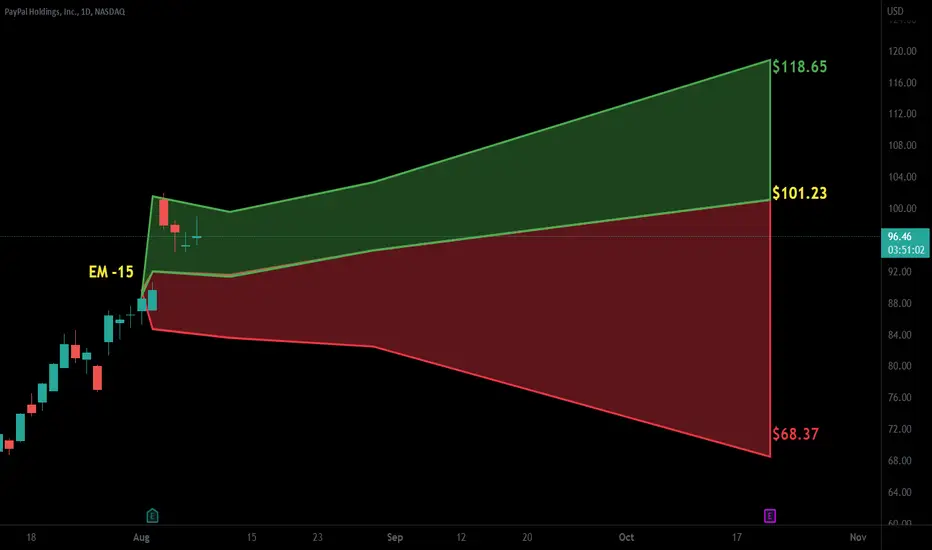
$92~$96 zone is the key level!in weekly time frame, the next destination of paypal stock is $92~$96.
after that:
- if the market unwell, we might see $65.
- if the market well, we might see $112 or $136.
so be caution at this level.

PYPL: Can Hedgie change fortunes?PayPal
Short Term - We look to Buy at 78.86 (stop at 71.88)
Activist hedge fund Elliot Management reported to have increased stake. Price jumped 6% in premarket. Although the bears are in control, the stalling negative momentum indicates a turnaround is possible. There is scope for mild selling at the open but losses should be limited. We look to buy dips. Further upside is expected.
Our profit targets will be 99.79 and 104.00
Resistance: 100.00 / 123.00 / 154.00
Support: 75.00 / 60.00 / 40.00
Please be advised that the information presented on TradingView is provided to Vantage (‘Vantage Global Limited’, ‘we’) by a third-party provider (‘Signal Centre’). Please be reminded that you are solely responsible for the trading decisions on your account. There is a very high degree of risk involved in trading. Any information and/or content is intended entirely for research, educational and informational purposes only and does not constitute investment or consultation advice or investment strategy. The information is not tailored to the investment needs of any specific person and therefore does not involve a consideration of any of the investment objectives, financial situation or needs of any viewer that may receive it. Kindly also note that past performance is not a reliable indicator of future results. Actual results may differ materially from those anticipated in forward-looking or past performance statements. We assume no liability as to the accuracy or completeness of any of the information and/or content provided herein and the Company cannot be held responsible for any omission, mistake nor for any loss or damage including without limitation to any loss of profit which may arise from reliance on any information supplied by Signal Centre.

pypl flagexpecting paypal to continue in this range during premarket making higher lows and then to break the 74.00 pivot, if 74.00 break happens during premarket then i will expect a higher low to be made and then continue towards the 75.00 level.

SELLPayPal is still under bearish pressure.
By the volume zone (point of control), we can identify who controls the market - bulls or bears and analyze the point of support and resistance.
In March 2020, the high volume zone acts as strong support and the bulls made a bull run with gains of 257%.
Since then, the sellers have jumped into the game and broke the volume zone at 185 that was previous support and now turn resistance (formed as bear flag).
Another volume zone that broke by the bears is at 105 which is now resistance point.
The last breakout of the volume zone is a very high volume area with many bears that are going to defend their positions so I suspect we are going to see the bearish triangle break to POC at 45.

In 5th wave, yet another 40-50% downWave 4 of the down-trend has been completed flat formation on Friday. Now the 5th wave is unfolding with possible targets around $41-45.
RSI is in overbought area what supports the idea of selling.

PayPal to new heights soon?!Once the retail zone is taken out, we will look to exploit the institutions going long and ride their wave!

PYPL, good for the long term?There are a lot of trendlines to act as resistance, but price down here is extremely appealing to me.
1-Above 75.28
2- Retest and rejection of lows at 68.65

approaching some RSI resistance 🥝paypal is getting overbought now, but over 82.68 long trigger I expect more upside and maybe rally towards 100+
below 73.27 we will most likely see new 52w lows

$PYPL - Paypal Looks Setup Nice for a Gap FillSome things looking good here - and a lot of people are short. Lets see a lil gap fill.

MACD FOR PAYPAL MACD line rises above the signal line, on the other hands, the indicator gives a bullish signal indicating that the assets prices is likely to rise hence it may be time to buy.

MACD FOR PAYPAL MACD line rises above the signal line, on the other hands, the indicator gives a bullish signal indicating that the assets prices is likely to rise hence it may be time to buy.

PYPL swing longHey all, I've got a potential swing long play on PYPL with a tight stop loss at a fresh 52w low. Let's see how it goes.

PYPL DAILY WOLFE WAVE SETUPThere is a daily wolfe wave setup. The projected target is calculated by extending a linear line between pivot 1 and 4 and projecting the line. This is represented as the green perforated line, as shown in the chart. The projected target is 84 which is expected to reach this price target anytime before earnings. There is also a gap that remains open. If markets trades green, the next few days, then PYPL may experience short term momentum that would attempt a gap fill at 84 before earnings. Stop loss consideration would be at 67.00.
