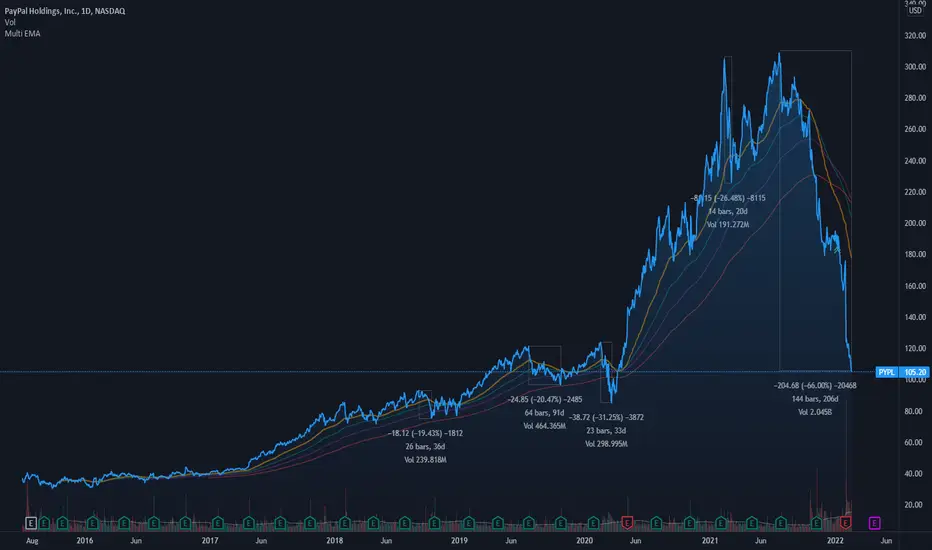
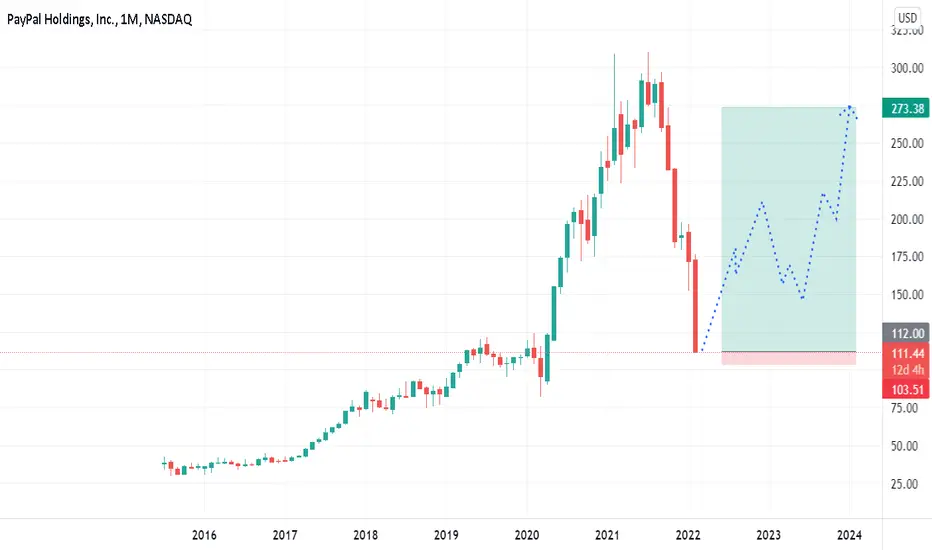
This is what I want to see on PYPLThe first thing to say is, "I'm faaaar away from developing a setup right now on PYPL; when things are melting, trying to find a bottom is a really unprofitable business (or at least for me). So that's why I use relevant supports/resistances or trendlines as main levels before thinking about developing new setups.
In this case, the first trading opportunity I would be interested in is IF the price can break the first trendline. IF that happens, I want to see a correction, and a setup on a new high may be a good opportunity to get exposure to a new bull run.
I would like to add to this explanation why I always wait for breakout + correction before trading. This is because most of the time, we don't observe levels being broken like if nothing were there, most of the time when the price reaches or breaks a key level we will tend to observe some kind of retracement (this is valid both for bearish and bullish directions).
Waiting for this is a good way of avoiding fakeouts because you are not entering on the first breakout. This means that your drawdowns will tend to be more controlled because you are able to avoid A LOT of low-quality situations by doing this. The negative side is that sometimes the price breaks the level like if nothing were there and you miss the setup (however, I have realized that this is the exception)
Going back to the PayPal explanation, I think patience will be my strategy here; I want to see a clear bottom which means observing several more candlesticks before saying "oh, this is reversing" and then paying attention to the descending trendlines, as the first place where I'm thinking on developing setups. At the moment, PYPL stays on my watchlist as "WAIT WAIT WAIT."
Thanks for reading! Please feel free to share your view and charts in the comments.
PYPL trade ideas

PayPal Weekly Technical AnalysisPYPL Weekly - No RECOMMENDATION or ADVICE Status / EDUCATIONAL only - Support, Resistance, Trend Lines , Fibonacci Retracement , Parallel Channels, Pitchfork - Hope it Helps, Good Luck

PYPL is turning into a nice value.PayPal is looking like a good value for a long term investment. TA wise this general area looks like a strong support zone as shown by the price volume profile (fractal is from Netflix)
Paypal is projected to have 20% yearly growth going forward and by 2024 EPS is expected to double. With a current PE of 29 and forward PE of 23 its starting to look cheap considering the projected growth and already strong profitability and business growth

$PYPL Key levels, Analysis & TargetsPYPL Key levels, Analysis & Targets
Forecasting stock prices using Fibonacci theory

PayPal Holdings, Inc.I admit that I do not know exactly what is behind this brutal decline.
But I believe it is largely exaggerated. Paypal in the biggest discounts of its history..
For me - accumulation signal based on graph, but if I bought, I would look deeper..

Paypal stock analysis ready to Attractive point#PayPal stock analysis is reaching a turning point.
The return range is $ 91 to $ 97 and can fluctuate as shown for two to three months. The first growth target is $ 120-126.

PayPal CarnageProbably the biggest broken higher tier tech name on Wallstreet over the last 6 months and the one most oversold on weekly timeframes, for many fundamental reasons. Personally watching the 111-120 price range closely for early signs of reversal.
Still a long journey on this one.

looking for quality stocks?If you are looking for quality stocks, this is what you are looking for, 56% from here just to cover a MEGA GAP, strong fundamentals, low PE ratio 15 and the price is at pre pandemic levels when nobody used internet to buy everything.

PAYPAL approaching the price I was waiting for. After I missed the price in this zone the previous time this time, now I will not let it escape without me.
Recent reports weren't too strong earning report was missed out. but the company is still existing and strong and profits are expected to grow (more than 18% next year).
On the technical side
1. It looks like Elliott wave close to being ending (ABC) - target price 104$
2. 104$ price range is also strong support from a trend line that if we break it we will probably see 94$ and conformation of a new trend line-there are also GAP to If the price is achieved.
3. We entered a zone that is also with high supply-demand.
Not financial advice!

How To Catch A Falling Knife...Since September PYPL has been having a bad time. Sucks for those holding shares, but for others, it sets up a good opportunity for large gains.
There are two scenarios I'm expecting to play out
1. It goes down to the weekly SR level and volume area at ~$100 and reverses from there. If that doesn't happen, exiting before the gap under $97 is the move.
2. Assuming the first doesn't play out and it gaps down, I am expecting the monthly SR level to hold. It held during the covid crash, so I think its a decent bet. Obviously if it is volatile, wait for price to settle down before entering and manage your risk accordingly.
Very good RR here.

PLPY buy. Try two.Last try on PYPL long was 122 - 124 and out 118. Going to try again. Super tight stop. Hopefully if it's going lower it hits my stop in trading hours and does not gap it.
PYPL at May 2019 levelIf you haven`t sold the stock ahead of earnings:
Then you should know that PYPL is at the May 2019 level and approaching its strongest support area.
I would expect some consolidation here, until they figure out how to lower those commission fees that are `killing` the people who are using PayPal. From my personal experience as a seller, i try to avoid PayPal as much as i can because of the fees. :)
Strong competitors are coming.
Looking forward to read your opinion about PYPL.


PayPal Holdings INC - Is This A BargainPayPal – 70% Decreased in its share price:
PayPal has begun moving downwards since Jul 16 2021 & has retraced 70% away from its all-time high. The decreased in PayPal’s share price fell further after the company released their earnings guidance and made comments to reduce their goal of new users and instead focus on sustainable growth and driving engagement. Analyst are saying the decreased in price is also due to PayPal’s user growth slowing due to higher inflation which may be leading to reduced consumer spending and the fact that ‘eBay’ (a PayPal customer) is in the process of having their own payment platform. However, eBay represented 3% of revenue and less than 3% of total payment value (TPV) in Q4-21. Some analyst are saying that PayPal’s price has fallen due to the 2020 Q4 profit figures being better than Q4 2021.Still, PayPal has ended Q4 with strong momentum and has shown annual increases in the following areas, to just list a few:
• Annual Revenue
• Profit
• Increase in Free Cash Flow
• Transaction Volume
• BNPL Transactions
• Unique Consumer Accounts
• Merchants with PayPal BNPL Transactions
• Merchants With Upstream Presentment
Conclusion – PayPal shows consistent increase in their financial returns year over year - based on their balance sheets/annual reports. Though the stock price has rapidly & drastically decreased in value due to short term projections of ‘slower’ growth – PayPal is still a great company which has not seen any major changes in their fundamentals or management team. The reduce in the company’s share price can be viewed as an opportunity for investors who are focused on the long-term opportunity and not bothered by the short-term headwinds which pose little threat to the company’s long-term success. PayPal is positioned extremely well within their industry which is filled with huge growth opportunities around where ecommerce and the digitization of payments are continuing to evolve and gain adoption. Despite the competition, PayPal appears very well positioned to evolve and growth and appears to have great value from an investment perspective.
The company, PayPal, its Directors and CEO (Frank, David & Dan) have all made significant purchases into company following its recent sell off.
PS - I did not do much research into PayPal competitors. Feel free to look into that area or comment if I should research it and update this post.
Patience Pays!
What's the rush?
- Maradona Capital

$PYPL almost @ the .886!!Paypal went through a massive correction.
This is a level, where one could think about investing into Paypal for the longer term.
The long term uptrend is still fine.
Good luck on your trading, stay safe!

PayPal (PYPL) | Possible Short-term Rejection AreaHi,
Why short-term? Yes, after you have made your analysis, you can start loading your long-term positions also from the shown area but to me, it looks like it stays there for a while. Despite that, possibly we can catch the first movements upwards.
Atm my scenario would be: bounce from the shown area to around +20 to +50% then back to around $100. For me, it isn't very logical that if we get a bounce then it would be the bottom. After such a huge slump the price needs to rest a bit but still, I would like to share this area for short-term investors.
Do your own analysis and invest cautiously!
Regards,
Vaido

Low Risk Entry Zoneyou can set SL under the supportive channel or w8 untill price going above that !

$PYPL Paypal Bullish Bat Given the current climate in the market and the tension with Russia and Ukraine, youll want to wait for a confirmation of a bottom and reversal here, or perhaps begin building a position slowly.
We have officially hit the measured move of the Double top, and the PCZ of the bullish bat at a historical inflection point.
Now perhaps that isnt enough just yet to confirm a reversal, but if you do a little leg work youll see everyone is very bearish on paypal, and this latest impulse is likely a capitulation move. All the while, Paypal has quietly established a cryptocurrency and blockchain advisory counsel.
cointelegraph.com

PayPal INC - Discounted By 70% PayPal is very a well known company - this chart inspires me to learn more about the company and see if there is still future long-term value behind the company, it's vision, management team & financial records. Should there be, I will wait for a slight form of bullishness and consider making an investment as a learning experience and a long term hold.
Hope you find value in this!
- This is NOT financial advice - please do your own research.
- Maradonacapital

PYPL LONG STOCK ENTRY SOON...PYPL has had a significant decline from its highs last summer. The weekly RSI is in the teens. I believe we touch 108-112 for a great initial entry & then a possible retest of 100 for an average down opportunity. However, beware we do have a gap to fill from COVID levels. Careful as this is much lower, but as long as 100 holds, we should be okay!

lets see what happens this week 🔻pypl continuing the dip, smashed through every target mentioned in my last analysis! congrats to the shorts ! if PayPal does not break back above recent resistance my next target is 90-100.
like and follow for more 💘

PAYPAL CORRECTION 2022Keeping the analysis that the correction of the companies had to come back to the original value (channel 2018-2019)
Here is PAYPAL CORRECTION
