RACEFerrari S.p.A. is an Italian luxury sports car manufacturer based in Maranello, Italy. Founded in 1939 by Enzo Ferrari, the company built its first car in 1940, adopted its current name in 1945, and began to produce its current line of road cars in 1947.
Re-testing the breakout level.
RACE/N trade ideas

$RACE continue downtrend on short but reversal possible tooNYSE:RACE short made $$$ from first call. Now a pause to short and may see further downtrend. Reversal is also possible hence it is good to short only when go below LOD 29 Dec. DYDD. No position just testing my theory.
#RACE What recession? Ferrari racing away!i0.wp.com
Stock has broken out of this broadening pattern to reach new all-time highs with a measured target of at least $360.00 after beating expectations and and raising guidance.
Ferrari Stock Is on Track to Hit All-Time Highs — WSJ
Nov 3, 202321:31 GMT+2
RACE
+1.78%
By Hardika Singh
The company that makes some of the hottest cars in the world has a hot stock.
Ferrari shares recently rose 2.4% to $331 Friday, on course to set at a record high, after the Italian sports-car maker on Thursday reported earnings (www.wsj.com) that exceeded expectations.
The company raised its full-year guidance after profit jumped 45% and revenue grew 24% in the third quarter from a year ago, thanks to a better sales mix and higher demand for vehicle customization.
Ferrari shares are up 54% this year.

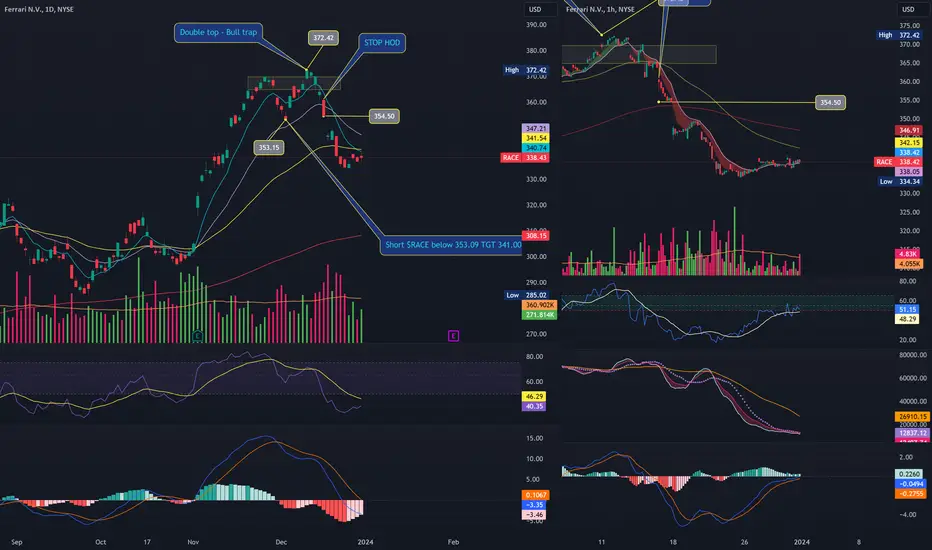
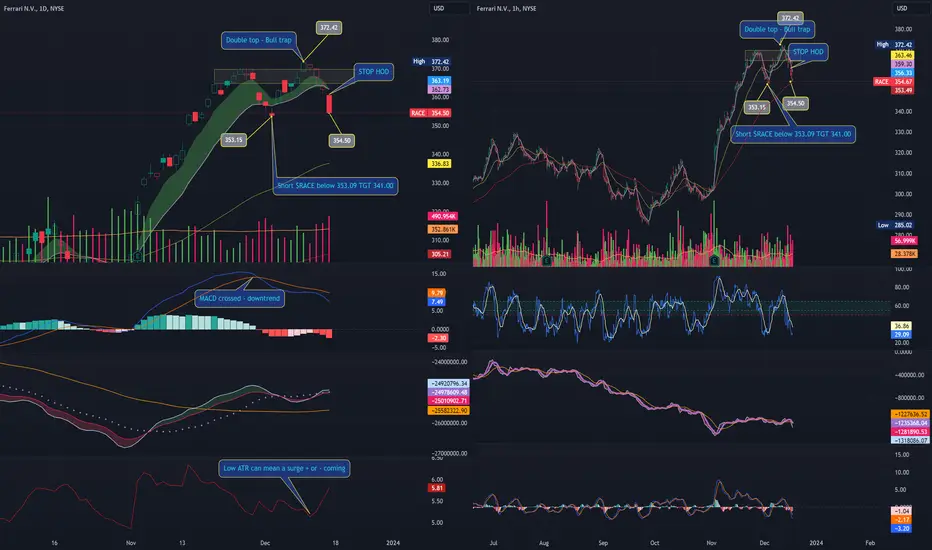
Ferrari breaking out downside.Ferrari in a very clear textbook #Distribution since a few days.
Institutions accumulating your Stop Losses.
So a super Flat channel - no subjectivity there.
We're missing a #BullTrap - Ideally I like to see one. Will be surprised if it breaks down so easily.
But still taking the trade at 930 EST Monday open - its 5x if it works.

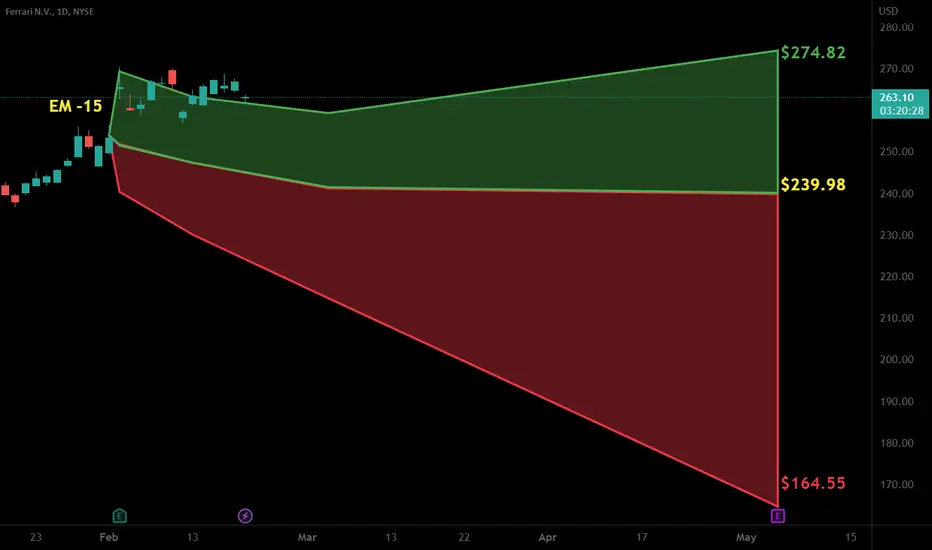
$RACE short term trading planI've included a weekly trade plan for RACE (Ferrari) with points to watch at the weekly close, need a close below yellow and green supports right now, this week should give a strong signal.
Once that happens we have to capture a 12% swing to low as that's a strong support area, where we will be looking for re entry short or long depending on the general market and index positioning.

Ferrari to Start Accepting Crypto Payments in U.S: ReutersFerrari (RACE) will start accepting cryptocurrency as a payment method in the U.S., according to a report by Reuters on Saturday.
The Maranello, Italy-based luxury sports car manufacturer will subsequently extend the scheme to Europe in response to demand from its wealthy customers, Reuters reported, citing Chief Marketing and Commercial Officer Enrico Galliera.
Ferrari will use crypto payments provider BitPay to process transactions in bitcoin (BTC), ether (ETH) and stablecoin USD coin (USDC) in the initial rollout in the U.S.
Some are young investors who have built their fortunes around cryptocurrencies," Galliera said. "Some others are more traditional investors, who want to diversify their portfolios."
Despite crypto's popularity as an investment tool, for major companies to accept it as method of payment remains rare. In February 2021, Elon Musk's electric-car company Tesla (TSLA) began accepting bitcoin payments but discontinued the service only three months later, citing environmental concerns over the electricity usage involved in bitcoin mining.
Neither Ferrari nor BitPay immediately responded to CoinDesk's request for comment.

Ferrari begins accepting crypto currency as means of paymentThis is huge for Ferrari and we are expecting a surge in price for the RACE Ferrari stock

Race Ferrari:Hitting the Brakes on a Volatile Day
Race Ferrari (NYSE) presents an enticing opportunity for investors looking to go long in the luxury automotive sector. Ferrari, known for its iconic brand and high-performance vehicles, has demonstrated resilience amid economic uncertainties.
One compelling reason to consider a long position is Ferrari's strong brand loyalty and demand for its premium cars, which has shown no signs of waning. Additionally, as the global economy recovers, luxury car sales tend to rebound strongly.
With a track record of steady growth and a commitment to sustainability, Ferrari is well-poised for future success. Its expansion into electric vehicles and continued focus on innovation ensures it remains at the forefront of the automotive industry.
Furthermore, technical analysis reveals positive signals, including moving averages and relative strength index (RSI), supporting a bullish outlook.
While no investment is without risks, Ferrari's unique market position and promising future prospects make it an attractive choice for those considering a long-term investment strategy in the automotive industry.

RACE - finished already or one more lap to go?RACE has been a great buy for plenty of people but I can't help thinking that it might be about to start a 5th of a 5th wave or perhaps have even finished a 5 wave Elliott Wave cycle already. The red count suggests that we are in a 4th wave correction and can expect to see a final 5th wave some time soon. The alternative blue count is much more pessimistic and suggests that the climb is over already and we can expect a marked decline going forward. The fact that the channel sees a 5th wave top and rolls over might lend it some weight. Personally I prefer the red count as in my opinion a number of other counters are displaying similar 4th wave corrections and patterns at the moment.

RACE 4d best level to buy/hold 100% gains 🔸Hello traders, today let's review4 daily price chart for RACE/Ferrari. Measured move
pullback in progress right now, however overall strong chart indicates further upside possible.
🔸Strong sequence of higher lows and higher highs and new higher lows
new higher low expected near 210/215 usd. currently pullback in progress so it's recommended
to wait until pullback is over before reloading. buy/hold setup for patient traders only.
🔸Recommended strategy bulls: expecting pullback based on measured move projection
set to extend further down towards 210/215 usd. Bulls should focus on buying low later
after the pullback is complete later in Q4 2023/Q1 2024. reload bulls near 210/215usd.
Based on measured move projection new high expected at 500 usd. 100% upside in this trade.
🎁Please hit the like button and
🎁Leave a comment to support our team!
RISK DISCLAIMER:
Trading Futures , Forex, CFDs and Stocks involves a risk of loss.
Please consider carefully if such trading is appropriate for you.
Past performance is not indicative of future results.
Always limit your leverage and use tight stop loss.

FERRARI ($RACE) at the resistance area!From a technical point of view, Ferrari ( NYSE:RACE ) Stock Trend is bullish, but at the same time it has reached an important resistance area around $300/320, and from here it could trigger a short-term corrective structure. The minor structure 12345 might be completed, but as we can see from the chart, it might be a wave 5 of 3 (major), so once the correction is completed, I don't rule out a new bullish leg.
Trade with care!
Like if my analysis is useful.
Cheers!

PERFECT Put/Short Setup grabbed a few puts here 1 month out. 230 is first PT
Double topped here
MACD and RSI rolling over

$RACE with a bearish outlook following its earnings #Stocks The PEAD projected a bearish outlook for $RACE after a positive over reaction following its earnings release placing the stock in drift B with an expected accuracy of 100%.
Race to the Bottom? Ferrari's day in the sun may be over and the possibility to purchase a share at $86 may become a reality.
Yellow Box: Resistance/Supply
White Diagonal Line: Liquidity
Green Horizontal Line: Support/Demand

Ferrari Rising Wedge in Long TermWhen we look at the Ferrari graph on an annual basis, we see a rising wedge. Generally, assuming the wedge has broken downwards, the next target will be the $150 level. If we need to support this technical analysis with fundamental analysis, it is striking that especially the PEG ratio is too high. As long as the wedge doesn't break higher ($218), I will keep the $150 level as a target. When it reaches the $150 level, I will analyze the target again on my page for a buying opportunity.

RACE-Ferrari Ferrari symbol in the stock market.
The price has broken the downtrend line and will correct.
To notify the analysis, follow me and contact me if you have any comments or questions.

RACE- Ferrari N.VI analyzed the Ferrari symbol in the stock market.
Follow me, like, comment, and ask questions.
For the Long-term time frame, there is still an upward trend.
However, the price in the mid-term time frame is corrected in a wedge.
So it can find an entry zone to buy after the end of the correction.
Observe the money management and the stop loss.

$RACE with a Bullish outlook following its earnings #Stocks The PEAD projected a Bullish outlook for $RACE after a Negative over reaction following its earnings release placing the stock in drift C.

RACE to triangle support RACE has been on the decline since nov 2021 and bounced off the 181 support twice forming a declining triangle.
Taking a short term bullish trade from the last bounce and watching the price action for any weakening to get out.
Currently holding this trade as MACD and RSI are going bullish - planning to exit when the RSI becomes overbought.
27/5 Planning to move my stop to reduce risk and watch the 4hr candles for the 27th and decide if i need to move the stop again or keep holding.

RACE - FERRARI - Double Button05/19/2022 (mm-dd-yy)
TARGET 215-231
TRIGGER 196
STOP 1 = 181
STOP 2 = 170
Historic:
05/19/2022 (mm-dd-yy)
Fear & Greed Index: 29
Mid-term forecast (1-2 weeks):
If price breaks the 196 resistance, a resumption of a strong uptrend is expected.
Aiming at 215 (1-2 weeks) and 231 (2-4 weeks)
If the support a 181 breaks, the short-term forecast (resumption of the downtrend) will not be valid.
We will close our open trades if the 181 or 170 level is broken in the medium term.
Technical analysis:
A DOUBLE BUTTON on the flooir forms on the daily chart between 177 and 181, starting on 03/09/2022.
This week it can break 196 and is expected to rise to 215 and 231 according to technical analysis and confirmation of the pattern.
+ Trigger:
Trigger1= 196
+ Take Profits:
TP1=215
TP2=231
+ Stop:
Stop1=181
Stop2=170
❤️ If you find this helpful and want more FREE forecasts in TradingView
. . . . . Please show your support back,
. . . . . . . . Hit the 👍 LIKE button,
. . . . . . . . . . Drop some feedback below in the comment!

RACE | Ferrari A Ditching CarMy position and play is marked on the chart. Expecting selling to continue and target is the bottom zone at $206-$209 level.

