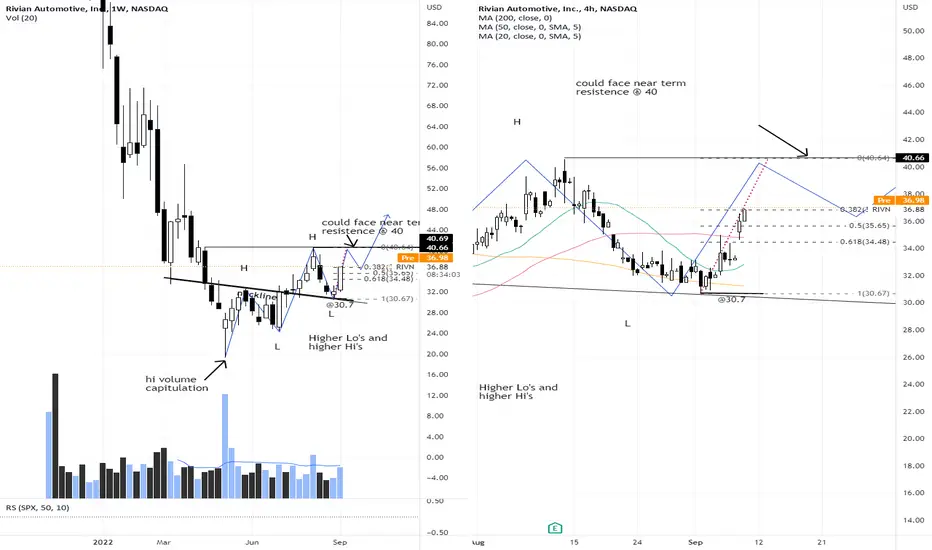
RIVN - Trending upRIVN had a high volume capitulation at the start of July and has since been forming higher low's and higher high's (apparent on weekly chart).
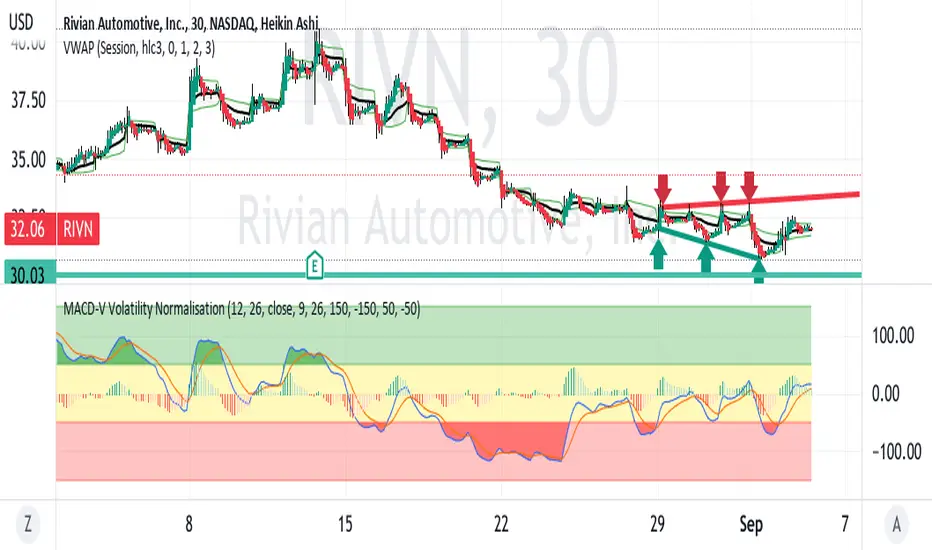
It has retraced to retest the neckline support on 1st Sep (@ 30.70) forming a new higher low. The up trend is now apparent and clearly there is room to go higher in the mid to longer term
Expect some resistance around 40-41, however it is unlikely to breach the recent low at 30.70.
One can use fibonnacci retracement find likely supports for any near term retracements. Retracements of no more than 50% of the upswing is preferred and a sign that the uptrend momentum is intact.
Disclaimer: Just my 2 cents and not a trade advice. Kindly do your own due diligence and trade according to your own risk tolerance and don't forget that money management is important! Take care and Good Luck!
RIVN trade ideas
Forecast for RivianThis is my first post and I am still a novice. Any differing ideas please let me know. You can't learn without being challenged. Hopefully this helps someone out there.
Wave 1 and 2 are clearly visible here. Knowing the length of Wave 1 helps us to determine/predict where Wave 3 will end.
$24.62 is the 1.618 Fib line of Wave 1. This would be a good place to take a long position for a Wave 4 retrace.

RIVN Descending Megaphone Pattern SHORTRIVN is in a slow down trending pattern right now within a megaphone
reflecting increasing volatility. The MACD shows the downward momentum
with more of the histogram negative below the zero level.
At present, the K / D lines are crossing over and above the histogram.
characteristic of a reversal to the downside.
Based on pivots in June and July, the horizontal support is at ~ $30.
Accordingly, a target on a short trade setup is just before $30.
This appears to be a good short trade setup where Rivian is
following the downtrend of the sector leader TSLA.
$RIVN - A lot of classical technical analysis nuggetsAnother trendy asset. Of course I had to take a look at through the lens of my favorite timeframes (W-M-3M)
I did not find a satisfactory swing trade in these time frames from a risk to reward perspective.
I did find though a lot of classical technical analysis nuggets worth noting for savvy technical analysis learners out there.
They are pretty much ostensible in the chart with comments laid.
Regarding my bias and analysis of the current stat of the market:
1. Market structure:
Market just broke out its downward sloping trendline. Theory and logic entails that what follows is an accumulation phase, a ranging market preceding.
In ranging markets we stack the odds on our side in case we buy at support and sell at resistance. Provided of course we get the triggers.
2. What is support and resistance here:
Price volume divergence as highlighted, preceded by a RSI bullish divergence + trendline breakout + wide bullish candle at support back in July advocate that support / demand are in the $20/30 range.
3. Trigger?
Already past us. It emerged back in July. Right now judging by the logical place where we ought to place our stop loss (below support with enough buffer) and the logical place where we ought to place our take profit (at resistance - purple area above), then a swing trade does not make sense right now from a risk to reward perspective.
Of course you can always, provided you know what you are doing, rely on the strong bullish signal we are getting from this support area and buy to hold for a long long time until price reaches its ATH for instance (where there is an ostensible supply area).
A lot of scenarios are possible. Bear in mind though, that if you are bullish here, there are a lot of overhead obstacles.
Just manage risk at all times, at all costs. This must override any other principle.

RIVN breaking from 3 month consolidation ⚡nice break above resistance, also holding above local trend support now, break of that support will lead to a dump back into consolidation.
if it holds above we can target 45.9-53

RIVNPlaying lottos on RIVN it might be zero tomorrow, But let's see if this play works out. Manage your own risk...

earnings on deck for $RIVN beaten down growthFundamentally we all know that RIVN was overvalued from day one and was in many ways a poster child for the growth at all costs movement of 2020/21. However, after shedding 80% of its value perhaps it is finding some interest. Like most growth names it has picked up in recent weeks but still faces overhead supply on any large bull run.
All that said I have seen a fair number of their trucks on the roads of Colorado this summer and sales will eventually broaden. As long as they can keep up on both manufacturing and company management this may in the long run prove to be a good buy. I will be waiting for earnings before making a move myself.

RIVIAN About to break its 3 month Channel upwardsBack in May we called for a short-term buy on Rivian (RIVN) but warned investors not to get overexcited:
This time however we find quite a few reasons to be excited as following the break above its Falling Wedge, the stock formed a Channel Up that is about to break upwards on today's strong rise. Within this Channel, the price also succeeded in breaking above both the 1D MA50 (blue trend-line) and the 1D MA100 (green trend-line) and in fact a Bullish Cross between the two is emerging.
The 1W RSI has been steadily rising from its previous oversold state and is now above the 40.00 mark, so if the price breaks above the Channel Up, we expect RIVN to aim for the 56.90 March 30 High, which is the current Resistance. A break above that level, which happens to be on the 0.236 Fibonacci retracement level form the market Top, would constitute a long-term trend shift to bullish.
--------------------------------------------------------------------------------------------------------
Please like, subscribe and share your ideas and charts with the community!
--------------------------------------------------------------------------------------------------------

RIVN NeutralExpecting a pull back 1. $33 2. $31 3 $29
1. For a strong 3B for day/blue pivot spike -- towards $40/50 (with strong ER)
2/3. For pivot consolidation pivot building

RIVN Long TradeRIVN has been correcting for a long period of time, and after a long consolidation, the price is trending up.


$RIVN calls$RIVN calls look good above 07/29's high of day. Possibly entering a volume gap too, which can send it!

Possible breakoutRivian Automotive, Inc. engages in the design, development, and manufacture of category-defining electric vehicles and accessories. The company was founded by Robert J. Scaringe in June 2009 and is headquartered in Irvine, CA.

Stock Price Action PredictionsBest short term buying potential in a really long time. Sell for pull back in first week of Sept.

RIVN - Hourly Thoughts RIVN has broken out of a long downtrend for the first time (dashed line)
This break out in my opinion will be short lived and a retest above this line will occur
This retest will also result in a double bottom along a horizontal
Double curved line indicates my thoughts on price action
If a retest does not result, break out further will ensue

RIVN ShortIn downtrend, bounce back to resistance
Trendline break + retest
Earning 8/19/2022 Estimate -1.6
Short 30
Stop 38
Target 10
Risk management is much more important than a good entry point.
I am not a PRO trader.
In my trading plan, the Max Risk of each short term trade should be less than 1% of an account.

Three drives Rivian Three drives pattern emerged.
Breakout of strong resistance level, but is it another false breakout like last time?
Great indicator of a reversal would be to see RSI sustain above 56.
Fingers crossed it works out.

RIVN last leg up before abc corectionOn daily we see clear Elliot formation with last leg up about to form.
We may see this happen this week, unless market in general flashes down.
Target 34
Good luck

RIVN So far we have a clear rising wedge built here with higher lows in higher highs. We are cleaning to support right now and if we do lose the support we could see a drop in the back test as resistance of this pattern. However because it’s so early in this wedge in my view I don’t think it’s gonna break down here I think it’s actually going to go sideways and then end up popping up to the upside. If we do pop to the upside the rising wedge resistance above is around $34. So although this is a Baarish pattern I am looking to see the this move up a few dollars from here. I would short closer to that 34$ range upon rejection, therefore bullish shortterm

RIVN almost ready to dump??I'm doing something different with this post from my typical MO. I like simple charts with an over abundance of confirmation. This chart is slightly more complex, layering in stochastic in the 50d MA as well as the fibs for the most recent downward run. The extra complexity is needed in this example because it builds a trifecta of technical indicators on top of an already overpriced stock.
Let's quickly look at why RIVN is where it is today.
IPO north of $100/share to bring in 16B in cash
EV car hype ballooned the price, realization that a brand new car company is worth more than all incumbent car companies has brought it back down
Price hit a local bottom at 19.25, meaning the company was trading at less than the amount of cash in the bank
RIVN continues to lose ~2B a quarter, even with exceptional growth it will lose billions per quarter for years to come.
It is my opinion that the most recent bounce is 100% technical and not institutional buy and holders that will elevate the price long-term. Given that operational risk is exceptionally high - that is, to meet the current valuation the company will have to meet or exceed growth targets for the next 7-8 years (minimum) - the value of the company right now is primarily driven by the amount of cash in the bank. Every day that the company operates it should intrinsically be worth $50 million less (assuming they continue to lose 1.5B in cash per quarter as they did most recently, albeit previous quarters were only losing 500M, I believe this is extra loss is due to ramp up in spend post IPO).
Alright, philosophy aside, let's look at the technicals. There is the potential for three indicators to converge at precisely the same time at the same place. For reference, the price target I have to short is 33.60:
The fib retracement from the most recent run down has 33.60 as the 38.2% level
The 50d MA is moving down, currently at 34.88, targeting 33.60 in 2-4 days.
Stochastics are flashing over bought
And oh yea, did I mention this is all happening inside of a rising wedge?
Once the 33.60 range look look for confirmation with a break below the rising wedge and a nice ride down. In this market I'm taking profits early and often but could see a complete move down to $22 (which puts the market cap about equal with the amount of cash it has in the bank).

RIVN: Doing its first BULLISH STRUCTURE ever!Hello traders and investors! Let’s see how RIVN is doing today! For the first time, RIVN is doing a clear bullish structure, and this could indicate a reversal ahead.
In the daily chart, we see that for the first time ever, RIVN has a clear bullish structure, as it just did a higher high/low, and triggered a pivot point. In addition, it is trying to leave the 21 ema behind again (it tried to do that in the past, but with the lack of bullish structure, it failed miserably).
Keep in mind that this is the early stage of a reversal, and the situation is still risky. Another key point we must pay attention is the red line at $ 33.46. This point worked as a support and resistance in the past, and could work as a resistance again. In the end, RIVN must break this point to confirm a reversal, and not lose it again.
By breaking this line, RIVN could do a pullback to its 21 ema in the weekly chart, at least, near the $ 50 (the 21 ema is descending, so it’ll be lower in the next weeks, keep that in mind).
Either way, we have a lot of upside potential in the mid-term. This is not a long-term reversal yet, as the trend is clearly bearish on RIVN since its IPO in November.
I’ll keep you guys updated on this, so remember to follow me to keep in touch with my daily analyses!

RIVN - Symmetrical Triangle, 15 MinRIVN is a Symmetrical Triangle chart pattern based on the 15 minute timeframe.
Watch RIVN during premarket and watch for a successful breakout on either side.

i will be bullish for rivian if this scenario happenthis stock has been bearish since launch started and synchronizate with crash and crisis , so i think if break the trend line i will wait for pullback and decided if i'm getting buying this stock or not , this my analyse it's not recommended to buy or sell that's depend on you and your strategy , " you need to stick wth right horse "
