SEDG forming double bottomsReasons for bullish bias:
- Price is at strong support
- Price formed double bottoms on weekly
- Entry at neckline breakout for further confirmation
- Strong bullish divergence
Entry Level(Buy stop): 106.25
Stop Loss Level: 58.17
Take Profit Level 1: 154.33
Take Profit Level 2: Open
SEDG/N trade ideas


SolarEdge to Reduce 16% of Workforce SolarEdge ( NASDAQ:SEDG ), a prominent player in the renewable energy sector, finds itself grappling with significant challenges as it navigates through turbulent market conditions. Despite its innovative solutions and prior successes, the company's recent performance has been overshadowed by a slew of setbacks, including a stark downturn in revenues and a daunting inventory backlog.
Earnings Report
The company unveiled a bleak outlook for the first quarter of 2024. With revenues projected to range between $175 million to $215 million, substantially lower than analysts' expectations of $406 million, SolarEdge's ( NASDAQ:SEDG ) stock took a nosedive, plummeting as much as 23% in extended trading. This downward spiral comes on the heels of a challenging period marked by persistently high-interest rates and sluggish demand in the residential solar market.
CEO Zvi Lando attributed the company's woes to a confluence of factors, including adverse market dynamics and an inventory glut resulting from a sudden downturn in demand. SolarEdge ( NASDAQ:SEDG ), known for its expertise in manufacturing inverters crucial for converting solar power into electricity, found itself saddled with excess inventory amidst weakening sales. Lando highlighted the struggles faced in both European and U.S. markets, with the latter expected to remain subdued until interest rates witness a significant decline.
To address the looming inventory backlog and mitigate the impact of dwindling revenues, SolarEdge ( NASDAQ:SEDG ) announced sweeping measures aimed at cost reduction and operational streamlining. This includes a substantial workforce reduction of 16%, closure of select manufacturing sites, and strategic exits from certain business segments. While these measures are aimed at bolstering the company's resilience in the face of adversity, the road ahead remains fraught with uncertainties.
Looking ahead, CEO Zvi Lando expressed cautious optimism regarding the potential rebound of the European residential solar market in the first quarter, followed by gradual improvement thereafter. However, the timeline for clearing the inventory backlog extends well into 2024, underscoring the prolonged challenges confronting SolarEdge ( NASDAQ:SEDG ). Amidst intensifying competition and a rapidly evolving regulatory landscape, the company finds itself at a critical juncture, requiring swift and decisive actions to regain its footing in the market.
Conclusion:
SolarEdge's ( NASDAQ:SEDG ) recent travails serve as a stark reminder of the inherent volatility and challenges pervasive in the renewable energy sector. As the company charts its course through choppy waters, stakeholders remain vigilant, awaiting signs of a potential turnaround. The path ahead may be fraught with obstacles, but with prudent management and strategic initiatives, SolarEdge ( NASDAQ:SEDG ) retains the potential to emerge stronger and more resilient in the long run.

SolarEdge Faces Turbulent Times Amidst Layoffs and Revenue FallSolarEdge ( NASDAQ:SEDG ), once a stalwart in the renewable energy sector, finds itself at a crossroads as it announces a massive layoff plan, cutting 900 jobs – a move that underscores the harsh realities of a sharp decline in revenue. The company, which had witnessed an 80% drop in valuation, is grappling with unforeseen challenges, including postponed orders, cancellations, and a challenging macro environment for renewable energy companies.
The Downward Spiral:
SolarEdge's descent from grace has been rapid, marked by a series of setbacks that have eroded its market value. The company, a former member of the S&P 500 until just two months ago, now faces a four-and-a-half-year low in its stock prices since September 2019. The current market valuation of $3.9 billion is a far cry from its peak at $20 billion in mid-2022, when it stood as the largest Israeli company on Wall Street.
Revenue Fall and Analyst Surprises:
The heart of SolarEdge's predicament lies in its financial downturn. The company revealed that its revenues for the fourth quarter of 2023 are expected to be a staggering 55% lower than the already diminished figures from the third quarter. Analysts, caught off guard by the severity of the decline, had predicted a drop in revenue but not to such an extent. The third-quarter revenues of $725 million were themselves 27% lower than the second-quarter revenues of $991 million.
Factors Behind the Freefall:
SolarEdge attributes the sharp decline in revenue to a myriad of factors, including the postponement of orders and cancellations from customers and distributors in Europe. The company is also contending with increased inventory, a challenging macro environment for renewable energy companies, and the impact of changes in tax incentives in the U.S. and Europe. The rise in interest rates, making financing projects more expensive, has further strained the industry's sensitivity to cost increases in the renewable energy sector.
BlackRock's Contrarian Move:
Despite SolarEdge's woes, investment giant BlackRock has taken a contrarian stance, increasing its stake in the company over recent months. According to a report filed with the U.S. Securities & Exchange Commission (SEC), BlackRock held a 15.8% stake in SolarEdge at the end of 2023, up from 9% in its previous report in April 2023. This move raises questions about BlackRock's confidence in SolarEdge's ability to weather the storm and bounce back from its current challenges.
Conclusion:
As SolarEdge ( NASDAQ:SEDG ) navigates through these turbulent times, the layoffs and revenue plunge serve as a stark reminder of the volatility inherent in the renewable energy sector. The company's ability to adapt to changing market conditions, address internal challenges, and regain investor confidence will determine its future trajectory. In a landscape where renewable energy companies face multifaceted challenges, SolarEdge's journey unfolds as a cautionary tale and an opportunity for introspection within the industry.

Reality check - Game over!At current stock price, the P/E is extremely inflated above 70 !
SEDG has no reason to be trading at these prices whatsoever, once the last impulsive wave #5 is completed, the sell will come like a tsunami!
Good luck to bag holders!

Solar reboundSolar Edge technology stock experienced the most aggressive sell-off in 2023 since it went public. A rebound from pre-covid prices attracted investors and we saw one of the highest buying volumes in the stock's history.
This can be a sign of a bottom and a possible rebound to $100 and beyond. The first position was filled when the market opened.

SolarEdge SEDG Hitting Major Support ZoneStarting to see signs of a turn on SEDG. Volume coming in with a bit of sideways accumulation. I'm scaling in with a stop loss as pictured.

At support and may raise to 190?Sitting right at support and it can have a dead cat bounce towards 190. If it stays at current prices for few weeks, then may not be likely to bounce back.

Buy the dip - solaredge on the right track This might be one for the future, building a portfolio with value you believe in can only be rewarding.
Looks like everyone and their mother are eyeing towards solar one way or another, whether it is to save money every month, or be green, renewable energies will benefit from strong tailwinds in the near future, when inflation is tamed and everyone gets back to spending (mid 2024 ?)
In any case, despite missing estimates, fundamentals of the company remain good, market is still strong, only upside potential.
Target EOY low 240 USD

SEDG showing some signs of reversal.Similar to PODD, NASDAQ:SEDG is showing signs of abandoning its steep selloff following decent earnings. Volume shows that the bears are weakening, and the RSI 20 on the daily chart is attempting a bullish crossover. If it manages to find it's way back up, it has a nice gap to fill. I'll likely enter if volume begins to indicate that the bulls are showing back up.

SEDGE reversal short term, bearish for long term#sedge created W shape on 5mins chart.
#sedge can break 166$ next target 168$. This reversal will be failure if #sedge fall below 163.5$.
So far 168$ is strong resistance after #sedge drop heavily after earning.
If can break 168$ next target will be 175-177$
#sedge still bearish for long term.

#sedge first time oversold weekly chart #sedge heavy drop after earning. Weekly oversold first time from MAR-2022.
support : 179$/174$
Res: 184$/191$
My opinion will wait at 174$ to get in . My target will be 179/184/191/201
Stoploss : below 169$

SEDG WCA - Rectangle PatternCompany: SolarEdge Technologies
Ticker: SEDG
Exchange: NASDAQ
Sector: Technology
Introduction:
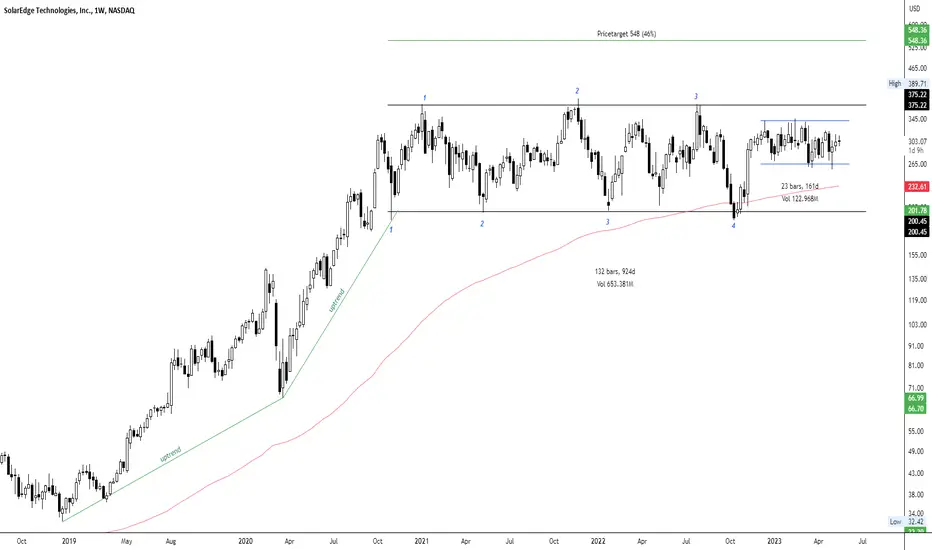
Hello, and thank you for joining me for this technical analysis. Today, we're examining the weekly scale chart of SolarEdge Technologies (SEDG), with particular focus on an intriguing pattern within a pattern – a shorter-term Rectangle nested within a longer-term Rectangle.
Rectangle Pattern:
The Rectangle pattern, which can serve as a continuation or reversal signal, is formed when the price fluctuates between parallel support and resistance levels. The pattern's resolution, and hence the direction of the trend, is determined by the direction of the breakout.
Analysis:
SolarEdge's price has been moving within a defined range for 924 days or ~30 months, forming a Rectangle pattern. The upper boundary of this larger Rectangle is at approximately $375 (with three touch points), and the lower boundary is at around $200 (with four touch points). The price is currently above the 200 EMA, which implies a bullish market environment.
Interestingly, within this longer-term Rectangle, a shorter-term Rectangle has formed over the last 161 days. A breakout from this shorter-term pattern could potentially offer an early entry opportunity.
Should we observe a breakout above the upper boundary of the larger Rectangle, the price target would be $548. This represents a potential gain of approximately 46%.
Conclusion:
The weekly chart of SolarEdge Technologies presents an exciting scenario, with a shorter-term Rectangle nested within a longer-term Rectangle. A breakout from the smaller pattern could provide an early entry, while a breakout from the larger Rectangle might confirm a continuation of the bullish trend.
As always, please remember this analysis does not constitute financial advice. It's essential to conduct your own research and consider risk management strategies when investing.
If you found this analysis insightful, please like, share, and follow for more updates. Happy trading!
Best regards,
Karim Subhieh
SEDG - Strong BullflagA bullflag like this means more upward movement is coming This bullflag is massive! Im using the non-log chart to show its structure. Expect upsides once this breaks out.

Symmetrical Triangle - Sympathy PlayEyeing the entire solar sector here as ENPH heads into earnings tomorrow after retracing back down to the 220 range. Intend to play both, however, SEDG is unique in the sense that there was not the usual retrace back to its respective 200-day MA and has been trading rangebound for quite some time now. Some slight hidden bullish divergence on the RSI, a big symmetrical triangle, a bullish gartley harmonic pattern, and increasing buyer volume relative to seller volume. Bullish and will be looking for a breakout from this triangle (Broader Market Conditions Permitting). Just some support and resistance levels to watch along with some RSI-based supply and demand zones to keep an eye on in the meantime- Price Targets & Previous charts are attached below
PT1- $325.71
PT2- $328.88
PT3- $334.29
PT4- $341.68 +
--Previously Charted--

Solaredge Multi-Timeframe AnalysisHello Traders,
welcome to this free and educational analysis.
I am going to explain where I think this asset is going to go over the next few days and weeks and where I would look for trading opportunities.
If you have any questions or suggestions which asset I should analyse tomorrow, please leave a comment below.
I will personally reply to every single comment!
If you enjoyed this analysis, I would definitely appreciate it, if you smash that like button and maybe consider following my channel.
Thank you for watching and I will see you tomorrow!


♻️ SEDG ✅Trade in the canalSolarEdge Technologies
Symbol NASDAQ:SEDG
Market Cap 11.70B
Short Float 3.18%
Target Price 330.50
P/E 78.03
Trading idea
Swing trade with 3 points of profit collection.
#1 - Target Price = 260$
#2 - Target Price = 290$
#3 - Target Price = 330$
Simple trade, long inside the channel.
As we see it has reached its support zone.
Change of direction points.
This is not a recommendation to buy or sell, just a trading idea.
Not an investment advisor.
Have Fun.

SEDG // Fibonacci studywedge indicator resistance on weekly timeframe
The targets were determined according to Fibonacci.

SEDG in a retest stage => Does it continue its bearish move ?NASDAQ:SEDG
According to the daily analysis, SolarEdge has broken the bearish triangle and now it's retesting the major support of 208 after a rejection.
A bearish move could continue and would try to achieve the next support of 180. We shoud have a confirmation before shorting it..
Stay tuned and enjoy!
We keep it touch..

$SEDG with a Bearish outlook following its earnings #Stocks The PEAD projected a Bearish outlook for $SEDG after a Negative Under reaction following its earnings release placing the stock in drift D.

Head and ShouldersPrice is below the neckline which is also the .382 of the trend up.
Ugly looking red candle today. Price retested the neckline this week but so far has not been able to make a sustained move back above it.
Possible stop above neckline.
No recommendation.
Price is below the bands which indicates serious selling pressure and possible oversold status.
Short interest is approximately 3.39%/Earnings 11-2.
EPS (FWD)
5.55
PE (FWD)
46.25
Div Rate (TTM)
-0
Short Interest
3.39%
Market Cap
$13.89B
SolarEdge Technologies, Inc., together with its subsidiaries, designs, develops, and sells direct current (DC) optimized inverter systems for solar photovoltaic (PV) installations worldwide. It operates through five segments: Solar, Energy Storage, e-Mobility, Critical Power, and Automation Machines. The company offers inverters, power optimizers, communication devices, and smart energy management solutions used in residential, commercial, and small utility-scale solar installations; and a cloud-based monitoring platform that collects and processes information from the power optimizers and inverters, as well as monitors and manages the solar PV system. It also provides residential, commercial, and large scale PV, energy storage and backup, electric vehicle charging, and home energy management solutions, as well as grid services; and e-Mobility, automation machines, lithium-ion cells and battery packs, and uninterrupted power supply solutions, as well as virtual power plants, which helps to manage the load on the grid and grid stability. In addition, the company offers pre-sales support, ongoing trainings, and technical support and after installation services. The company sells its products to the providers of solar PV systems; and solar installers and distributors, electrical equipment wholesalers, and PV module manufacturers, as well as engineering, procurement, and construction firms. SolarEdge Technologies, Inc. was founded in 2006 and is headquartered in Herzliya, Israel.
