$SOFIReady for a breakout upside to $6-7 in the next 2 months.
For a less risky strategy the wedge is yet to be broken and to confirm long.
This is a high risk play given the macro environment, debt ceiling, banking concerns.
SOFI trade ideas

SOFI long entry setup it seems almost bottom in my version of analysis
stop and target is marked on the chart..
good luck to u .

$SOFI Finds Support - Long/Call Blasted off after earnings and then got hammered down quickly. Now it's found some support and we should see a nice bounce here. May take some time to fill the gaps, but this company has solid fundamentals.

SOFIDepending on the world financial credit situation SOFI looks like a good choice. If the government raises the debt celling and the fed cuts rates and begins easing after a small panic, the situation should be fine by Q2/Q3 2024

sofi is buy in 2-3 month aheadsofi is buy in 2-3 month ahead , it’s making a diametric pattern in couple of weeks but after this correction it can be moved to high level or new high level

SOFI Hidden Bullish Divergence I think SOFI has the hidden bullish divergence on daily, it pull back fill gap and then continues go up

$SOFI - RecoveringNASDAQ:SOFI #SOFI what a brutal ER reaction. The technical setups great for the bulls going in that changed after ER. The investors are concerned with the company's loan book. Gap at $5.48 might close. $5.84 - $6 will be tough over head resistance. 👀

SOFI: Bullish Head and Shoulders at a Bullish Butterfly PCZSOFI is currently trading and forming a Bullish Head and Shoulders at a shared confluence zone between the log scale 1.618 and the linear scale 1.272 Fibonacci Extensions which in both cases would be the PCZ of a Bullish Butterfly; While it is possible that it could go deeper into the linear 1.414 Extension I do believe that the action we're seeing from the price right now at the current level warrants a Bullish Entry.
SoFi having just over $0.5B Under Management is overall a much smaller bank than many of the banks we've seen come down and may come to as an advantage as they have less liabilities and yet they are gradually growing.

$SOFI - Ouch! That was brutal!Going into the ER, the setup was good. But the sell off after ER destroyed bullish technicals. It dropped below all moving averages. For the bulls the stock needs to climb back above $5.87.
$5.48 is current support. The stock might drop to $4.79 - $4.36 area, if that fails.
------
Not an investment advice.

SOFI down big on earnings report Sofi down big after reporting earnings and in my opinion this is a buying opportunity with big guidance in the future

$SOFI - Bullish earnings report expectedHas to get past resistance here, and then we can expect some targets near $6.57

$SOFI - Held down below $6.00NASDAQ:SOFI #SOFI $6.00 has been acting like Kryptonight. Stock has been bouncing around a few cent within narrow range. Bollinger band is narrowing. The MACD about to cross zero line. It will have to decide soon. 👀

SOFI: Buy ideaBuy idea on SOFI as you see on the chart after the breakout with force the vwap.Thanks!

Upcoming earnings will reveal the strength of SoFiIn my opinion, SoFi's current position in the fintech industry is strikingly similar to how Amazon benefited during the dot-com crash. As the banking sector faces a crisis, I believe SoFi is poised to capitalize on the situation, much like Amazon did when numerous internet startups went under, leading to an influx of consumers flocking to Amazon.com.
As traditional banks grapple with failures and massive deposit outflows, consumer confidence wanes, providing SoFi with an opportunity to capture market share and boost deposits. SoFi's resilience, marked by a lack of deposit outflows and increased FDIC insurance coverage, mirrors Amazon's ability to emerge stronger from the dot-com bubble. I think this positions SoFi for accelerated growth in the midst of the banking crisis, just as Amazon thrived during the dot-com crash.
In conclusion, I personally believe that SoFi is on the verge of an "Amazon moment," where it can leverage the banking crisis to become a dominant player in the financial industry, continuing to innovate, expand, and deliver impressive results in 2023 and beyond. This parallel makes SoFi an attractive investment opportunity, in my view.

that changed fastWe have a lot overhead here but it's okay.
This is why we trade real companies hahahah.
When the chart looks bad, we go right back to the earnings and realize we're vibing.
I am in at $5.71 I want a dollar a share. Will probably trim otw up.
I really think this could yield me a dollar a trade, but we'll see. I don't mind holding her but I'd rather not.
Good luck

this is more like itThe last triangle I posted was a bit to short sighted.
From this perspective it looks way better, and we have a strong break out.
Fundamentally we could see $8 but short-term price action can send us into the high $6 I think.

TriangleIt does look like she can cool off, but we'll see what overall market does.
IMO if we have a green $ARKK and $SPY we'll have a green $SOFI and it will be enhanced from the technical factors and just good company.
Price targets are around the $7 range, and I like that. Cut the weeds!

Still within the trading rangeSofi should bounce here if the FOMC meeting goes well for the market tomorrow. Hopefully we get a dovish .25 rate hike. Big caveat there as "HOPE" is not why we buy a stock. If Sofi falls below the trading range then sub 5 is in play, on the flip side if Sofi breaks 6 then the breakout continues.

Has Warren Buffett Overlooked $SOFI?The fintech industry has seen one of the most exciting growth trends as it revolutionizes how people access financial services. Right now there are over 30,000 fintech startups and by the end of 2021, fintech investment reached a total of $210 billion. The fintech sphere is only expected to grow, so I believe it is a very attractive industry for investors and Warren Buffet seems to think so too.
The Oracle of Omaha has been making large investments in multiple fintech companies. In fact, Buffet has invested over $900M (107.1M shares) in the Brazilian company, Nu Holdings, and $907M (30M shares) in ALLY. This is a huge investment even for someone like Buffett. Nu Holdings is actually his 8th largest investment in terms of shares. This raises the question, why has Buffett invested in these other fintech companies, but not in SoFi?
Throughout this post, I’ll be talking about SoFi, ALLY, and Nu Holdings - comparing their pros, cons, and similarities. My goal here is to see if there is room for 3 top dogs in the fintech industry or not.
How are Nu Holdings & SoFi similar?
But Nu Holdings & SoFi share one very important thing in common. They both want to be a one stop shop for financial services.
Since SoFi specializes in student loan refinancing, it creates a bond with younger customers who - hopefully - will turn into lifelong customers that use SoFi for all their banking needs. Similarly, Nu Holdings offers credit cards to customers younger than 18 in Brazil - capturing a demographic of young people who will hopefully become lifelong customers.
This means that both companies could continue to grow and expand as their customer base grows older and younger generations adopt their services as well.
How does ALLY compare to SoFi?
The main difference is the source of Ally’s revenue. 65.6% of Ally’s total revenue in 2022 came from the auto finance industry, while SoFi’s edge is student loan refinancing. In 2019, SoFi generated 59.7% of its revenue from student loans. But it’s worth noting that it can be quite difficult to qualify for student loan refinancing if you have a bad credit score whereas it’s a bit easier for people to get auto loans.
How are Ally & SoFi similar?
Ally & SoFi both offer commission free stock trading for investors with a high APY as well. Ally’s savings account offers 3.60% APY and SoFi offers 3.75% APY with a direct deposit. This means that with a direct deposit, you’ll earn a higher APY with SoFi, but without one, you’d earn a higher APY with Ally.
Both companies offer multiple services such as mortgage loans, credit cards, insurance, etc. and are online banks with no physical locations. Given their different niches, it makes sense that Ally’s customers tend to be millennials while SoFi’s customers tend to be students or fresh graduates.
SoFi’s Edge
So after going through the pros and cons of all three of these companies, you might be wondering if SOFI has what it takes to gain market share in the growing Fintech industry.
I believe SoFi has an edge over these two competitors when it comes to diversification. The two pictures below show the type of services that SoFi & Ally offer. SoFi is constantly trying to increase its market by opening up different services to attract new customers. To name a few:
SoFi Relay: Allows members to link all their existing deposit accounts, investment accounts, & retirement accounts into a single mobile dashboard.
Money Vaults: Helps users prioritize saving money. Vaults are used to save money for a certain purchase to be made in the future (Ex. Car or house).
Retirement accounts: Traditional, Roth, & SEP IRAs
Traditional: Traditional retirement account, withdrawable
Roth: Allows you to contribute after-tax dollars, and then withdraw the money tax free in retirement.
SEP IRA: A retirement account for someone who’s self-employed.
SoFi Protect: Gathers details to get comparisons on insurance providers to find the best rate for you
SoFi Invest:
Crypto investing: offers trading for 30 cryptocurrencies with a 1.25% charge per trade
Stock investing: stock and ETF investing commission free
Automated Investing with goal setting, auto rebalancing, & Diversification
Loans:
Wedding loans: Loans used to purchase an engagement ring, wedding, or honeymoon with a low fixed-rate personal loan from $5k-$100k.
Travel Loans: Loan used to travel. Low fixed rate personal loan from $5k to $100k.
Law school loans: Loan for Law school students. Competitive rates, exclusive member benefits, & no fees
MBA Loans
Home Improvement loans
Cyber Insurance: Protection from Cyber financial fraud, cyber extortion, identity theft, phishing scams
SoFi Insights: Tracks all your money in one place on the mobile app, monitor your credit score, set multiple goals, track your spending
Estate Planning: Partnered with Trust & Will to give members 15% off their trust
I recently learned that SOFI is even letting its customers get early access to IPOs which could draw more traders to the company’s services. If SOFI underwrites more IPOs, investors like you and me may join its platform just to get in on that action. Personally, I think this is a fantastic service because up till now IPOs have been a very exclusive process.
Besides diversification, SOFI’s focus on student loan refinancing is also a plus imo. College education is essential in the US and without a college degree, most people can only get so far in their career
For instance, 53.7% of the US working population in 2021 graduated from college and at least 75% of new jobs require a college degree.
When you factor in the average cost of tuition - which has soared 31.4% from 2010-2020 - and that the average student debt among college graduates is $28,000, SOFI is in a great position to profit from this sector.
Given this inflationary environment & higher interest rates, I think that demand for student loan refinancing will only increase. This is because employers are constantly looking for people with degrees & the number of jobs requiring this are increasing every year. So it's no surprise that CEO Anthony Noto recently said “We’d expect the demand for that product (student loans) to really go through the roof and be back to normalized levels that we saw in 2019.”
But with the student loan pause in place, SOFI is losing a lot of money. The company stated that it has lost $300M to $400M and it's pushing very hard to get a decision passed ending the student loan moratorium. The Supreme Court already heard the oral arguments regarding the case and is expected to give a decision in June.
If things are not resolved by then or the Supreme Court rules against federal student loan forgiveness, then payments are expected to resume by the end of August. This is because payments are expected to start up again, 60 days following the ruling.
Needless to say this would be a huge catalyst for SOFI and I, personally, believe that the Supreme Court will rule in SOFI’s favor. And the flood of refinancing requests that could come in once this limbo ends could give SOFI’s revenues a much needed push. With this in mind, June will be a make or break moment for SOFI.
Now, you might be thinking ‘that’s great and all but what about Buffett’s 8th largest investment by shares? OP is just some dude on the internet and this is THE Warren Buffett’.
Well, you wouldn’t be wrong. It's hard to argue against Warren Buffett’s logic and I think NU could be a good investment as well, but compared to SOFI, I think that it presents a lot more risk.
For one thing, Brazil has just gotten out of one of its worst economic crises in history and with a new government taking over there’s a lot of uncertainty. Corruption is very high in Brazil, and banks which provide their services almost exclusively to the rich in Brazil could use their power to turn the government against Nu Holdings if they feel threatened.
Also, giving out credit cards to kids under 18 (even if the card’s benefits are limited) just sounds really risky to me. Given that most people in Brazil are not as financially well off as most US residents, its weaker currency, and struggling economy, Nu Holdings could face the greatest risk of all three companies. But time will tell whether the Brazilian government will make life easier or more difficult for a company like Nu Holdings.
So this means that ALLY, which also focuses on the US market for financial services, is probably SOFI’s greatest competition.
Both companies have a lot in common, but they’ve chosen to specialize in different niches. So let’s break it down:
91.55% of households reported having access to at least one vehicle in 2020, however, the number of registered vehicles declined between 2012-2019 by over 25 million.
The average cost of a car in 2021 was $42,258 with an average payment of $563 per month. Today, it costs an average of $48,080 to purchase a new car.
Moreover, around 31% of American adults have relied on auto loans to pay for their car in 2022.
Rising inflation has caused new vehicle prices to increase 5.8% YoY according to February’s CPI report, although used car prices decreased 13.6% from last year (probably due to overstock).
With ALLY being specialized in the auto industry, its fortunes may take a hit as the US enters a recession since consumers are less likely to purchase new or expensive vehicles when they are monitoring their budgets. New vehicle sales dropped nearly 40% during the 2008 recession and I believe history is likely to repeat itself here if the economy enters a recession.
Regardless of the potential hit to the automotive sector, when you compare auto loans to student loans you quickly see that student loans take the cake.
The market size of the Auto leasing, loans, & sales financing industry is $173.2 billion, while the student loan industry is a massive $1.76 trillion. So SoFi has the upper hand here in terms of the market potential.
With college tuition constantly increasing & students entering college year after year,
SOFI also has stricter requirements for qualifying for personal loans, such as a credit score of 680 and other factors which make their loans comparatively safer since its clients are more thoroughly vetted. This is good because it allows SoFi to minimize the potential risk of a customer not being able to pay back their loan in the future.
Conclusion:
So in conclusion, I think SOFI is in a fairly safe spot as long as the Supreme Court gives a favorable ruling. Since Nu Holdings operates in Latin America it won’t compete with SoFi for market share. Ally & SoFi also have different specializations but Ally is a more established FinTech company which could take customers from SoFi. Still, SOFI’s goal is to become a one stop shop for all financial services and it has diversified its services extensively over the years which could give it an edge in this industry.
Personally, I believe SOFI will be able to grow its customer base better than ALLY because it appeals directly to young adults heading into college. If these customers have a good experience, then SOFI can become their go-to financial service provider for the rest of their life.
On this note, the FinTech industry is on track for major growth especially since Covid-19 acted as a catalyst for the industry - leading to wider adoption at a time when contactless payments were becoming essential.
Besides this, the FinTech industry will likely continue to grow just out of sheer practicality. For one thing, Fintech cuts down servicing costs like maintaining physical branches while still providing a very high value service. As more and more transactions move online, the digital revolution continues to work in the industry’s favor and the widespread adoption of smartphones means that our phones will increasingly act as wallets. So it's not surprising that the use of Fintech companies increased 88% from 2020 to 2021.
Technical Analysis:
$SOFI has been stuck in a sideways channel since April 2022. The stock has a strong resistance at $7.59 which it tested on its positive Q4 earnings, however SOFI dropped almost 18% to its support at $5.25 due to market uncertainty.
Now trading at $5.20, SOFI is below the 50, 200, and 21 MAs on the daily timeframe. Despite this, I’m expecting a bounce and potential retest of the $7.59 resistance leading up to the Supreme Court decision in June since the RSI oversold at 30.
Right now SOFI is fundamentally oversold IMO. I bought 1k shares here as a starter with a stop loss at the $4.92 support. I’ll be averaging down under the $5.25 support or averaging up depending on the trend. My take profits will be the 200 MA, $6.43 resistance and the $7.59 resistance.

(Bullish) SoFi Stock Alert: Buy the Dip on This Fintech DarlingIf you wanted to build a profitable bank, how would you do it?
The founders of SoFi (NASDAQ:SOFI) certainly had the right idea. Instead of lending to businesses (which tend to chase after the lowest-possible interest rates), why not loan cash to rich kids instead? Or at least the kids you think will become rich in the future.
It’s a business that has worked. Mostly, anyway. In January, the company reported that its net interest margin had expanded to 5.94% after seeing deposits rise 46% in the quarter. And though SoFi still loses money every quarter because of its significant marketing expenses, analysts believe the bank could generate as much as $260 million in profits by 2025.

$SOFI - SIVB broke SOFIWell, this is the update to previous chart I published. Sad to say that $SIVB bank liquidity event broke the patterns.
Unexpected things happens. Thats why trading rules dictates to wait for pattern validations.
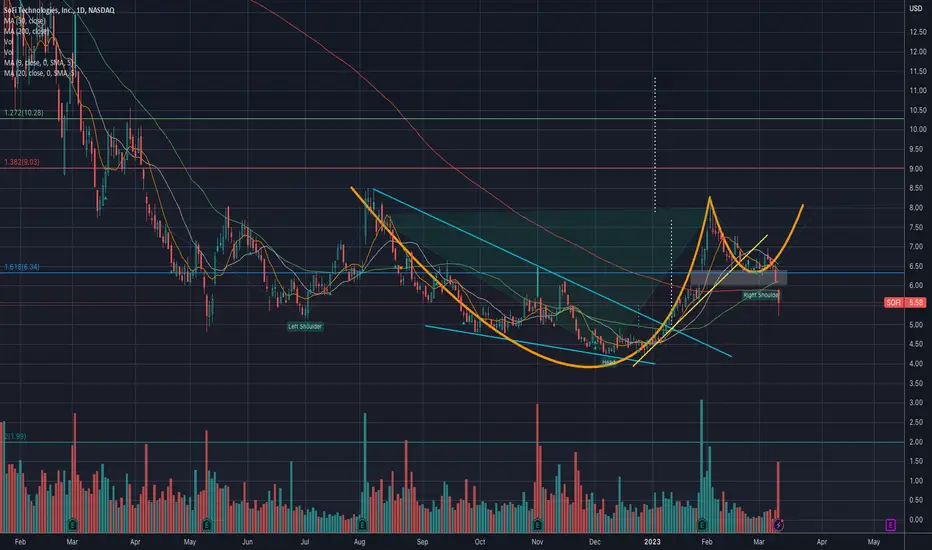
$SOFI -Refusing to close the gap so far. #SOFIThe gap below looks like it could fill but SOFI has resisted so far to fill it. If you are a bull you might be tempted to see two-in-one pattern.
1. Inverse head and shoulder (right shoulder has yet to be complete of course)
2. Cup and handle (handle has yet to be complete.)
If both pattern validates. Meaning price clime above the neck line around$8.50, it could have further upside to $11.
But frequently, the pattern can fail before validation.
How would you position? Bullish or bearish?
------------------------
Not an investment advice.

SOFI FINDING RESISTANCE AT LOCAL RANGE HIGHGood Morning Traders,
I wanted to touch base on SOFI Technologies
We see if finding resistance at out VAH of 7.03
If we are to see a bullish move to the upside, I would like SOFI to return to 6.14 and fill its gap from Jan 30, 2023
Test not only our weekly level, but also the POC before a continuation to the upside & out of our local range.
But until then, it is best to "Trade the Range Until it Breaks".
If you think you've gotten awesome content from my TA, please smash that like (boost) button!
It keeps me motivated to continue hitting the charts for y'all!!
I'd also love to see requests on any chart you'd like me to look at!
So please leave a comment on what Analysis you'd like me to do next! <333333
