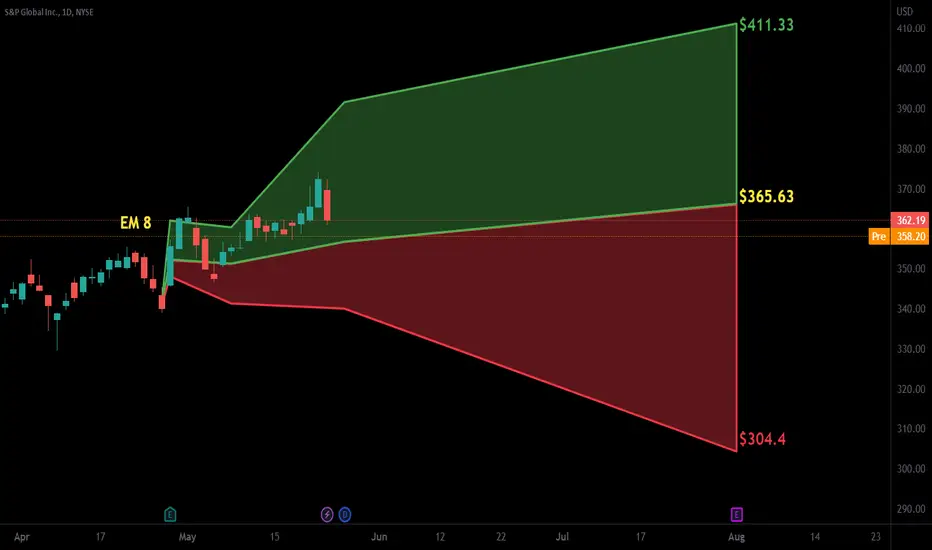
S&P Global Inc. short position Hi traders,
The price is approaching the previous all time high and we believe that it´s area where we can expect the profit taking therefore it can be the entry for a short position.
If we get rejection at the previous all time high, the pullback will be likely before any further uptrend continuation .
The target and the stop loss are shown on the chart.
Good luck!
SPGI trade ideas

Box on $SPGIThe hourly chart shows a bullish test of the ema 21/50 with a big box going on into the range $418-$441
An action higher would create a positive price action

SPGI - WeeklySPGI- currently down 28% from the ATH, and still in its downtrend.
Has reached and held support at 327. Might see another touch of 327 before attempt to change the trend by gaining yellow (360.55)
Targets in orange if 360.55 is gained as support.
If support is lost then targeting below in cyan.

$SPGI with a bearish outlook following its earnings #StocksThe PEAD projected a bearish outlook for NYSE:SPGI after a negative under reaction following its earnings release placing the stock in drift D .

SPGI S&P GLOBALA fantastic chart on which the head and shoulders pattern was formed. The price is at the level of 0.5 fibo. The goals of working out the pattern on the chart.

New addition to my portfolioI have just added SPGI to my portfolio
S&P Global Inc. provides credit ratings, benchmarks, analytics, and workflow solutions in the global capital, commodity, and automotive markets

$SPGI with a bullish outlook following its earnings #StocksThe PEAD projected a bullish outlook for NYSE:SPGI after a positive under reaction following its earnings release placing the stock in drift A with an expected accuracy of 60%.
SPGI - Bear ThoughtsHaving thoughts about a bearish move on SPGI
We have already seen a strong top now its just a matter of time before the second one arises and we see a double top.
Bearish bars pattern continuing the bear trend line.

$SPGI with a bullish outlook following its earnings #StocksThe PEAD projected a bullish outlook for $SPGI after a positive over reaction following its earnings release placing the stock in drift B with an expected accuracy of 50%.
SPGI. LONG IDEA.2ND stock trading idea!!
Open = 360.00
Target/TP = 390.00
SL= 350.00
Opening level = 360.00 Marks the Beginning for a possible bullish trend (primary/starting level)
Closing level = 390.00 A key level in the overall trend.
(THIS IDEA IS MAINLY BASED ON TECHNICALS)
(this is a personal idea based on what i am seeing MY CHART.)

Descending Broadening Wedge Breakout into DivvyDescending Broadening Wedge Breakout into Divvy
wait for old resistance to become support for entry play into next supply zone

$SPGI with a Bullish outlook following its earnings #Stocks The PEAD projected a Bullish outlook for $SPGI after a Positive Under reaction following its earnings release placing the stock in drift A with an expected accuracy of 50%.

SPGIit is an H&S with incorrect volumes but it is visible on weekly, I don't know if the volumes are important, maybe they are on the head but they are obscured by the enormous subsequent volumes and on the left shoulder they arrived a little late for the euphoria of the covid
perhaps in June there was a great build-up of sales
I'm interested in entering

SPGI ShortHello,
I see Head and shoulders but I think there will be retest for the neckline I will wait that to go short may be $(305 - 310) and my first target $268 and my be keep some for $220
Dyor, Not financial advice

SnP Global for further drops. SPGIA new fractal in formation post that rally on the daily. We are awaiting a revisit on the 0.618 level at first and for a divergence for an exit signal post. There is plenty of time for this to happen if Fibtime is to be believed.
We are not in the business of getting every prediction right, no one ever does and that is not the aim of the game. The Fibonacci targets are highlighted in purple with invalidation in red. Confirmation level, where relevant, is a pink dotted, finite line. Fibonacci goals, it is prudent to suggest, are nothing more than mere fractally evident and therefore statistically likely levels that the market will go to. Having said that, the market will always do what it wants and always has a mind of its own. Therefore, none of this is financial advice, so do your own research and rely only on your own analysis. Trading is a true one man sport. Good luck out there and stay safe.

SPGI shortSPGI- looks to be forming the right shoulder to the broder head and shoulders pattern. Not much to say but this play will take a while to play out. Final target 281.31 final C correction wave

$SPGI with a Neutral outlook following its earnings #Stocks The PEAD projected a Neutral outlook for $SPGI after a Negative Under reaction following its earnings release placing the stock in drift D.
SPGI - Longer Term Trend Line SPGI has formed an ascending broadening formation or a megaphone pattern in two situations with a common uptrend line
In the first situation price dipped to the longer term (green) Trend line once the pattern completed
As the second situation is completing now, price should result in the same position on the longer term trend line (indicated by the curvy arrow)

$SPGI ♡ S&P GLOBAL INC. ♡ +21.43%My trading plan consists of collecting 5 confirmations MINIMUM on one singular timeframe, across 4 different timeframes (20 total minimum) before I even propose a trading idea to my community.
♡
Disclaimer: Though I take banger trades, you MUST understand the following DISCLAIMER: I am NOT your financial advisor, a financial advisor, NOR do I give financial advice. If the market moves against you, you may sustain a total loss greater than the amount you deposited into your account. You are responsible for all the risks, financial resources, and trading system you utilize. You should not engage in trading unless you fully understand the nature of the transactions you are entering into and the extent of your exposure to loss. If you do not fully understand these risks you must seek independent advice from your financial advisor. This material is my market perspective and intended solely for educational & entertainment purposes.

Divergence and further market correctionThe stock market is due another correction. Focus on the RSI, this kind of divergence could be seen with BTC in summer 2021 which lead to a huge correction and brief bear market. Consecutive ATH's on both chart, whilst RSI showing weaker peaks. It would be expected to see another correction resetting RSI levels.

$SPGI with a Bullish outlook following its earnings #Stocks The PEAD projected a Bullish outlook for $SPGI after a Negative over reaction following its earnings release placing the stock in drift C.

$SPGI with a Bullish outlook following its earnings #Stocks The PEAD projected a Bullish outlook for $SPGI after a Positive Under reaction following its earnings release placing the stock in drift A.
If you would like to see the Drift for another stock please message us. Also click on the Like Button if this was useful and follow us or join us.

SPGI - Bullish after earnings releaseNice move after earnings , which should continue. Not sure how much. Maybe to 500. I didn't really figure that part out yet.
