$SpySo I just wanted to focus on the next 2weeks of trading..
To summarize what I think will happened
We make another high around 620 by End of this week. That high will most likely coincide either the Bill passing through senate or and the Non farm payroll coming out Thursday.
Summer melt up s
Key stats
About SPDR S&P 500 ETF TRUST
Home page
Inception date
Jan 22, 1993
Structure
Unit Investment Trust
Replication method
Physical
Dividend treatment
Distributes
Distribution tax treatment
Qualified dividends
Income tax type
Capital Gains
Max ST capital gains rate
39.60%
Max LT capital gains rate
20.00%
Primary advisor
State Street Global Advisors Trust Co.
Distributor
ALPS Distributors, Inc.
SPY Fund Summary
The investment seeks to provide investment results that, before expenses, generally correspond to the price and yield performance of the S&P 500 Index. The Trust seeks to achieve its investment objective by holding a portfolio of the common stocks that are included in the Index), with the weight of each stock in the Portfolio substantially corresponding to the weight of such stock in the Index.
The investment seeks to provide investment results that, before expenses, generally correspond to the price and yield performance of the S&P 500 Index. The Trust seeks to achieve its investment objective by holding a portfolio of the common stocks that are included in the Index), with the weight of each stock in the Portfolio substantially corresponding to the weight of such stock in the Index.
Related funds
Classification
What's in the fund
Exposure type
Electronic Technology
Technology Services
Finance
Stock breakdown by region
Top 10 holdings

SPY/QQQ Plan Your Trade For 6-30-25 : Gap Potential PatternToday's pattern suggests the SPY will attempt to create a GAP at the open. It looks like the markets may attempt to move higher as the SPY is already nearly 0.35% higher as I type.
Last week was very exciting as we watched the QQQ and the SPY break into new All-Time Highs.
I suspect the markets wi

Debugging Pine Script with log.info()log.info() is one of the most powerful tools in Pine Script that no one knows about. Whenever you code, you want to be able to debug, or find out why something isn’t working. The log.info() command will help you do that. Without it, creating more complex Pine Scripts becomes exponentially more diffi

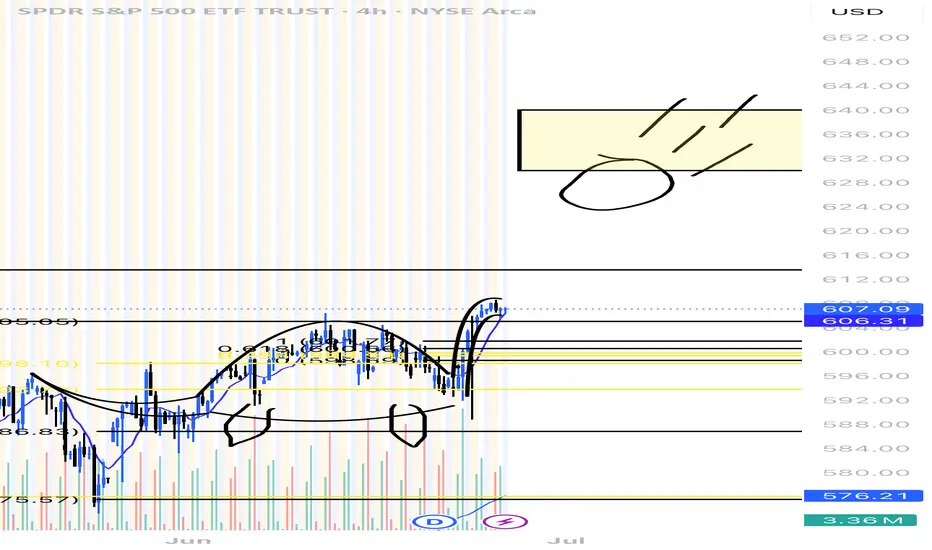
Dinosaur gets hit by a meteor We can see a clear breakout from previous lows only target left is that meteor at 630-640.
We will see this by the end of july!
SPY Technical Analysis! SELL!
My dear followers,
I analysed this chart on SPY and concluded the following:
The market is trading on 614.85 pivot level.
Bias - Bearish
Technical Indicators: Both Super Trend & Pivot HL indicate a highly probable Bearish continuation.
Target - 586.37
Safe Stop Loss - 631.68
About Used Indi

SP500 short USD is losing its reserve currency status but I guess it is also loosing its measuring cup status as well.
While people are cheering for all time highs in USD, SP500 in CHF does not look good at all.

SPY: Bearish Continuation is Expected! Here is Why:
Looking at the chart of SPY right now we are seeing some interesting price action on the lower timeframes. Thus a local move down seems to be quite likely.
Disclosure: I am part of Trade Nation's Influencer program and receive a monthly fee for using their TradingView charts in my analysis.
❤️ P

SPY/QQQ Plan Your Trade for 6-27-25 : Rally PatternToday's pattern is a Rally pattern. And after watching the markets rally higher over the past 15+ days, wouldn't it be funny to watch the markets roll over and move against my Rally pattern today? You know, the way the markets are beating up my SPY Cycle Patterns, it just might happen.
Gold is maki

SP500: Wave Estimation via FibsRegularities
Common angle
To estimate where it's heading to we use those recursive patterns and map them through fib scaling. Overall systematic wave expands in similar geometric narrative but with a compressed cycle.

SPY/QQQ Plan Your Trade For 7-1 : Post Market UpdateToday was a very powerful day for the Cycle Patterns - particularly for Gold and BTCUSD.
Gold rallied as the Cycle Pattern predicted a RALLY in TREND mode.
BTCUSD collapsed on a CRUSH Cycle Pattern.
The SPY Cycle Pattern predicted a Gap Reversal pattern. We did see the Gap today and a moderate re

See all ideas
Summarizing what the indicators are suggesting.
Oscillators
Neutral
SellBuy
Strong sellStrong buy
Strong sellSellNeutralBuyStrong buy
Oscillators
Neutral
SellBuy
Strong sellStrong buy
Strong sellSellNeutralBuyStrong buy
Summary
Neutral
SellBuy
Strong sellStrong buy
Strong sellSellNeutralBuyStrong buy
Summary
Neutral
SellBuy
Strong sellStrong buy
Strong sellSellNeutralBuyStrong buy
Summary
Neutral
SellBuy
Strong sellStrong buy
Strong sellSellNeutralBuyStrong buy
Moving Averages
Neutral
SellBuy
Strong sellStrong buy
Strong sellSellNeutralBuyStrong buy
Moving Averages
Neutral
SellBuy
Strong sellStrong buy
Strong sellSellNeutralBuyStrong buy
Displays a symbol's price movements over previous years to identify recurring trends.
Frequently Asked Questions
An exchange-traded fund (ETF) is a collection of assets (stocks, bonds, commodities, etc.) that track an underlying index and can be bought on an exchange like individual stocks.
SPY trades at 11,540.00 MXN today, its price has fallen −0.87% in the past 24 hours. Track more dynamics on SPY price chart.
SPY net asset value is 11,677.65 today — it's risen 2.28% over the past month. NAV represents the total value of the fund's assets less liabilities and serves as a gauge of the fund's performance.
SPY assets under management is 11.98 T MXN. AUM is an important metric as it reflects the fund's size and can serve as a gauge of how successful the fund is in attracting investors, which, in its turn, can influence decision-making.
SPY price has risen by 1.23% over the last month, and its yearly performance shows a 15.19% increase. See more dynamics on SPY price chart.
NAV returns, another gauge of an ETF dynamics, have risen by 2.28% over the last month, showed a 9.10% increase in three-month performance and has increased by 17.88% in a year.
NAV returns, another gauge of an ETF dynamics, have risen by 2.28% over the last month, showed a 9.10% increase in three-month performance and has increased by 17.88% in a year.
SPY fund flows account for 338.74 B MXN (1 year). Many traders use this metric to get insight into investors' sentiment and evaluate whether it's time to buy or sell the fund.
Since ETFs work like an individual stock, they can be bought and sold on exchanges (e.g. NASDAQ, NYSE, EURONEXT). As it happens with stocks, you need to select a brokerage to access trading. Explore our list of available brokers to find the one to help execute your strategies. Don't forget to do your research before getting to trading. Explore ETFs metrics in our ETF screener to find a reliable opportunity.
SPY invests in stocks. See more details in our Analysis section.
SPY expense ratio is 0.09%. It's an important metric for helping traders understand the fund's operating costs relative to assets and how expensive it would be to hold the fund.
No, SPY isn't leveraged, meaning it doesn't use borrowings or financial derivatives to magnify the performance of the underlying assets or index it follows.
In some ways, ETFs are safe investments, but in a broader sense, they're not safer than any other asset, so it's crucial to analyze a fund before investing. But if your research gives a vague answer, you can always refer to technical analysis.
Today, SPY technical analysis shows the buy rating and its 1-week rating is buy. Since market conditions are prone to changes, it's worth looking a bit further into the future — according to the 1-month rating SPY shows the buy signal. See more of SPY technicals for a more comprehensive analysis.
Today, SPY technical analysis shows the buy rating and its 1-week rating is buy. Since market conditions are prone to changes, it's worth looking a bit further into the future — according to the 1-month rating SPY shows the buy signal. See more of SPY technicals for a more comprehensive analysis.
Yes, SPY pays dividends to its holders with the dividend yield of 1.16%.
SPY trades at a premium (1.18%).
Premium/discount to NAV expresses the difference between the ETF’s price and its NAV value. A positive percentage indicates a premium, meaning the ETF trades at a higher price than the calculated NAV. Conversely, a negative percentage indicates a discount, suggesting the ETF trades at a lower price than NAV.
Premium/discount to NAV expresses the difference between the ETF’s price and its NAV value. A positive percentage indicates a premium, meaning the ETF trades at a higher price than the calculated NAV. Conversely, a negative percentage indicates a discount, suggesting the ETF trades at a lower price than NAV.
SPY shares are issued by State Street Corp.
SPY follows the S&P 500. ETFs usually track some benchmark seeking to replicate its performance and guide asset selection and objectives.
The fund started trading on Jan 22, 1993.
The fund's management style is passive, meaning it's aiming to replicate the performance of the underlying index by holding assets in the same proportions as the index. The goal is to match the index's returns.