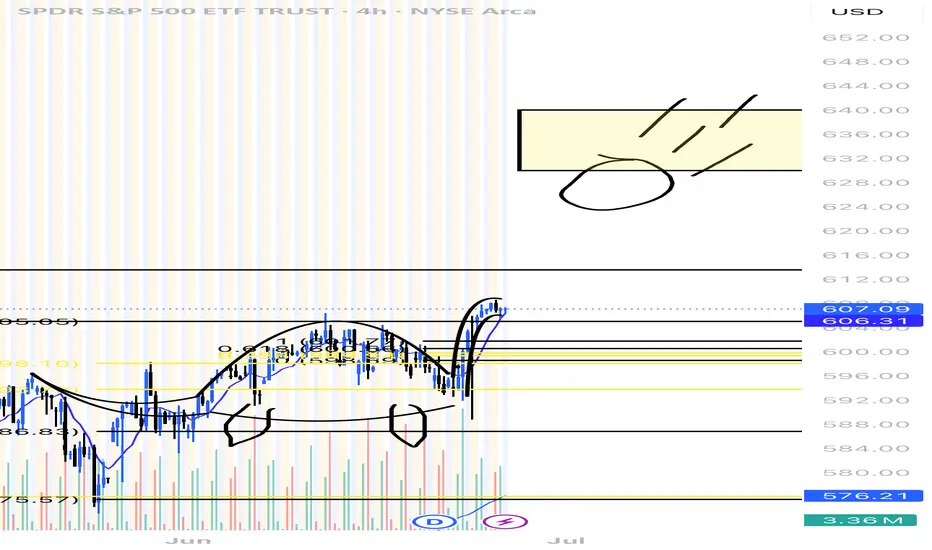
$SpySo I just wanted to focus on the next 2weeks of trading..
To summarize what I think will happened
We make another high around 620 by End of this week. That high will most likely coincide either the Bill passing through senate or and the Non farm payroll coming out Thursday.
Summer melt up seasonality is in progress.
Historically the week of July 4th trades with really thin volume. Thin volume is hurts bears more than it does bulls. Imagine spy breaking back below 600 with only 50% of its normal volume (Won't happen).
The week after this is the break between this quarter and the next Q3.. this is when I expect a corrective pullback to the 20sma or 605, they'll probably blame it on some Tariff July 9th related catalyst.
2nd week of July begins Q3 and the market will move up or down or earnings. From my experience, you rarely see Armageddon in the market before big tech earnings.
So basically 620 this week at some point , 605 next week and from there Earnings season starts off with big banks.
Some more trading advice I'd give is becareful with too far OTM weekly options, I expect at least 2 of these days will be terribly choppy.
One of the main reasons I believe the market will now go higher is because of the index moves... of course you saw the how spy and Qqq made a V shape recovery, well the Dow jones and IWM are now catching up with their own V
So if the Dow has 2-3% left to pump the Spy will atleast match that pump. This move could come next week or wait until the pullback and finish during earnings but it will come.
I'll do a bigger picture and out look after next week's move.
Some trade ideas I'll post here
First one is NASDAQ:GOOGL
Channel trade here..
I think early in the week googl heads to 181.50. If market melts up later in the week then googl could see 185.00.. but like I said this is a channel trade and the ultimate tgt is 190 ish .
2nd trade
Tsla
I think it's headed back to 300.00 or 200ema
From there we will either bounce and make a Pennant or double top lower .. if you look, you'll see price has been bouncing of its 50sma for 2weeks now, so the short entry is below that
Lastly, there is not enough volume to pump all stocks this week, so some will be red and some will be green.. to avoid longing or shorting the wrong one, have patience and wait 30min-1hour after the open for true direction before you trade ..
Good luck
SPY trade ideas

SPY/QQQ Plan Your Trade For 6-30-25 : Gap Potential PatternToday's pattern suggests the SPY will attempt to create a GAP at the open. It looks like the markets may attempt to move higher as the SPY is already nearly 0.35% higher as I type.
Last week was very exciting as we watched the QQQ and the SPY break into new All-Time Highs.
I suspect the markets will continue a bit of a rally into the early Q2 earnings season where retail traders attempt to prepare for the strong technology/innovation/AI earnings data (like last quarter).
I do believe this rally is due for a pullback. I've highlighted this many times in the past. Typically, price does not go straight up or straight down. There are usually multiple pullbacks in a trend.
So, at this point, the markets are BULLISH, but I still want to warn you to stay somewhat cautious of a pullback in the near future (maybe something news-related).
Gold and Silver should start to move higher over the next 5-10+ days, with gold trying to rally back above $3450. I see Gold in a solid FLAGGING formation that is moving closer to the APEX pattern.
Bitcoin is nearing a make-or-break volatility point. I see BTCUSD breaking downward, but it could break into a very volatile phase where it attempts to rally (with the QQQ through earnings), then collapse later in July. We'll see how things play out.
Remember, tomorrow morning I have a doctor's appointment. So I may or may not get a morning video done. FYI.
Get some today.

Debugging Pine Script with log.info()log.info() is one of the most powerful tools in Pine Script that no one knows about. Whenever you code, you want to be able to debug, or find out why something isn’t working. The log.info() command will help you do that. Without it, creating more complex Pine Scripts becomes exponentially more difficult.
The first thing to note is that log.info() only displays strings. So, if you have a variable that is not a string, you must turn it into a string in order for log.info() to work. The way you do that is with the str.tostring() command. And remember, it's all lower case! You can throw in any numeric value (float, int, timestamp) into str.string() and it should work.
Next, in order to make your output intelligible, you may want to identify whatever value you are logging. For example, if an RSI value is 50, you don’t want a bunch of lines that just say “50”. You may want it to say “RSI = 50”.
To do that, you’ll have to use the concatenation operator. For example, if you have a variable called “rsi”, and its value is 50, then you would use the “+” concatenation symbol.
EXAMPLE 1
━━━━━━━━━━━━━━━━━━━━━━━━━━━━━━━━━
//@version=6
indicator("log.info()")
rsi = ta.rsi(close,14)
log.info(“RSI= ” + str.tostring(rsi))
Example Output =>
RSI= 50
Here, we use double quotes to create a string that contains the name of the variable, in this case “RSI = “, then we concatenate it with a stringified version of the variable, rsi.
Now that you know how to write a log, where do you view them? There isn’t a lot of documentation on it, and the link is not conveniently located.
Open up the “Pine Editor” tab at the bottom of any chart view, and you’ll see a “3 dot” button at the top right of the pane. Click that, and right above the “Help” menu item you’ll see “Pine logs”. Clicking that will open that to open a pane on the right of your browser - replacing whatever was in the right pane area before. This is where your log output will show up.
But, because you’re dealing with time series data, using the log.info() command without some type of condition will give you a fast moving stream of numbers that will be difficult to interpret. So, you may only want the output to show up once per bar, or only under specific conditions.
To have the output show up only after all computations have completed, you’ll need to use the barState.islast command. Remember, barState is camelCase, but islast is not!
EXAMPLE 2
━━━━━━━━━━━━━━━━━━━━━━━━━━━━━━━━━
//@version=6
indicator("log.info()")
rsi = ta.rsi(close,14)
if barState.islast
log.info("RSI=" + str.tostring(rsi))
plot(rsi)
However, this can be less than ideal, because you may want the value of the rsi variable on a particular bar, at a particular time, or under a specific chart condition. Let’s hit these one at a time.
In each of these cases, the built-in bar_index variable will come in handy. When debugging, I typically like to assign a variable “bix” to represent bar_index, and include it in the output.
So, if I want to see the rsi value when RSI crosses above 0.5, then I would have something like:
EXAMPLE 3
━━━━━━━━━━━━━━━━━━━━━━━━━━━━━━━━━
//@version=6
indicator("log.info()")
rsi = ta.rsi(close,14)
bix = bar_index
rsiCrossedOver = ta.crossover(rsi,0.5)
if rsiCrossedOver
log.info("bix=" + str.tostring(bix) + " - RSI=" + str.tostring(rsi))
plot(rsi)
Example Output =>
bix=19964 - RSI=51.8449459867
bix=19972 - RSI=50.0975830828
bix=19983 - RSI=53.3529808079
bix=19985 - RSI=53.1595745146
bix=19999 - RSI=66.6466337654
bix=20001 - RSI=52.2191767466
Here, we see that the output only appears when the condition is met.
A useful thing to know is that if you want to limit the number of decimal places, then you would use the command str.tostring(rsi,”#.##”), which tells the interpreter that the format of the number should only be 2 decimal places. Or you could round the rsi variable with a command like rsi2 = math.round(rsi*100)/100 . In either case you’re output would look like:
bix=19964 - RSI=51.84
bix=19972 - RSI=50.1
bix=19983 - RSI=53.35
bix=19985 - RSI=53.16
bix=19999 - RSI=66.65
bix=20001 - RSI=52.22
This would decrease the amount of memory that’s being used to display your variable’s values, which can become a limitation for the log.info() command. It only allows 4096 characters per line, so when you get to trying to output arrays (which is another cool feature), you’ll have to keep that in mind.
Another thing to note is that log output is always preceded by a timestamp, but for the sake of brevity, I’m not including those in the output examples.
If you wanted to only output a value after the chart was fully loaded, that’s when barState.islast command comes in. Under this condition, only one line of output is created per tick update — AFTER the chart has finished loading. For example, if you only want to see what the the current bar_index and rsi values are, without filling up your log window with everything that happens before, then you could use the following code:
EXAMPLE 4
━━━━━━━━━━━━━━━━━━━━━━━━━━━━━━━━━
//@version=6
indicator("log.info()")
rsi = ta.rsi(close,14)
bix = bar_index
if barstate.islast
log.info("bix=" + str.tostring(bix) + " - RSI=" + str.tostring(rsi))
Example Output =>
bix=20203 - RSI=53.1103309071
This value would keep updating after every new bar tick.
The log.info() command is a huge help in creating new scripts, however, it does have its limitations. As mentioned earlier, only 4096 characters are allowed per line. So, although you can use log.info() to output arrays, you have to be aware of how many characters that array will use.
The following code DOES NOT WORK! And, the only way you can find out why will be the red exclamation point next to the name of the indicator. That, and nothing will show up on the chart, or in the logs.
// CODE DOESN’T WORK
//@version=6
indicator("MW - log.info()")
var array rsi_arr = array.new()
rsi = ta.rsi(close,14)
bix = bar_index
rsiCrossedOver = ta.crossover(rsi,50)
if rsiCrossedOver
array.push(rsi_arr, rsi)
if barstate.islast
log.info("rsi_arr:" + str.tostring(rsi_arr))
log.info("bix=" + str.tostring(bix) + " - RSI=" + str.tostring(rsi))
plot(rsi)
// No code errors, but will not compile because too much is being written to the logs.
However, after putting some time restrictions in with the i_startTime and i_endTime user input variables, and creating a dateFilter variable to use in the conditions, I can limit the size of the final array. So, the following code does work.
EXAMPLE 5
━━━━━━━━━━━━━━━━━━━━━━━━━━━━━━━━━
// CODE DOES WORK
//@version=6
indicator("MW - log.info()")
i_startTime = input.time(title="Start", defval=timestamp("01 Jan 2025 13:30 +0000"))
i_endTime = input.time(title="End", defval=timestamp("1 Jan 2099 19:30 +0000"))
var array rsi_arr = array.new()
dateFilter = time >= i_startTime and time <= i_endTime
rsi = ta.rsi(close,14)
bix = bar_index
rsiCrossedOver = ta.crossover(rsi,50) and dateFilter // <== The dateFilter condition keeps the array from getting too big
if rsiCrossedOver
array.push(rsi_arr, rsi)
if barstate.islast
log.info("rsi_arr:" + str.tostring(rsi_arr))
log.info("bix=" + str.tostring(bix) + " - RSI=" + str.tostring(rsi))
plot(rsi)
Example Output =>
rsi_arr:
bix=20210 - RSI=56.9030578034
Of course, if you restrict the decimal places by using the rounding the rsi value with something like rsiRounded = math.round(rsi * 100) / 100 , then you can further reduce the size of your array. In this case the output may look something like:
Example Output =>
rsi_arr:
bix=20210 - RSI=55.6947486019
This will give your code a little breathing room.
In a nutshell, I was coding for over a year trying to debug by pushing output to labels, tables, and using libraries that cluttered up my code. Once I was able to debug with log.info() it was a game changer. I was able to start building much more advanced scripts. Hopefully, this will help you on your journey as well.

Dinosaur gets hit by a meteor We can see a clear breakout from previous lows only target left is that meteor at 630-640.
We will see this by the end of july!
SPY Technical Analysis! SELL!
My dear followers,
I analysed this chart on SPY and concluded the following:
The market is trading on 614.85 pivot level.
Bias - Bearish
Technical Indicators: Both Super Trend & Pivot HL indicate a highly probable Bearish continuation.
Target - 586.37
Safe Stop Loss - 631.68
About Used Indicators:
A super-trend indicator is plotted on either above or below the closing price to signal a buy or sell. The indicator changes color, based on whether or not you should be buying. If the super-trend indicator moves below the closing price, the indicator turns green, and it signals an entry point or points to buy.
Disclosure: I am part of Trade Nation's Influencer program and receive a monthly fee for using their TradingView charts in my analysis.
———————————
WISH YOU ALL LUCK

SP500 short USD is losing its reserve currency status but I guess it is also loosing its measuring cup status as well.
While people are cheering for all time highs in USD, SP500 in CHF does not look good at all.

SPY: Bearish Continuation is Expected! Here is Why:
Looking at the chart of SPY right now we are seeing some interesting price action on the lower timeframes. Thus a local move down seems to be quite likely.
Disclosure: I am part of Trade Nation's Influencer program and receive a monthly fee for using their TradingView charts in my analysis.
❤️ Please, support our work with like & comment! ❤️

SPY/QQQ Plan Your Trade for 6-27-25 : Rally PatternToday's pattern is a Rally pattern. And after watching the markets rally higher over the past 15+ days, wouldn't it be funny to watch the markets roll over and move against my Rally pattern today? You know, the way the markets are beating up my SPY Cycle Patterns, it just might happen.
Gold is making a big move downward, which I attribute to a PANIC mode in the global markets. I believe this move downward in Gold is a reaction to some risk that is taking place in the financial markets. The US Dollar does not seem to be collapsing. The fear element is still elevated (as of last week's data).
Maybe this move in Gold is related to the SPY/QQQ moving to new All-Time Highs - but I doubt it.
We'll see if the move in Gold is really a panic selling phase or just some type of relief/pause mode in metals. Silver and Platinum are still trending upward.
BTCUSD is stalling near the upper range I suggest would become resistance.
As we move into the weekend and close out this week, I suggest traders try to prepare for what may come as the SPY/QQQ move into new All-Time Highs today. Either this trend continues higher, or we are going to get an immediate rejection in price. So be prepared.
Get some.

SP500: Wave Estimation via FibsRegularities
Common angle
To estimate where it's heading to we use those recursive patterns and map them through fib scaling. Overall systematic wave expands in similar geometric narrative but with a compressed cycle.

SPYOf course when I get out of SPY it sky rockets... this has continuously happened to me while trying to build up my small account. I get in make about 5-10%, take profits, then it jumps in the direction I get into. Wild. Any suggestions?

SPY/QQQ Plan Your Trade For 7-1 : Post Market UpdateToday was a very powerful day for the Cycle Patterns - particularly for Gold and BTCUSD.
Gold rallied as the Cycle Pattern predicted a RALLY in TREND mode.
BTCUSD collapsed on a CRUSH Cycle Pattern.
The SPY Cycle Pattern predicted a Gap Reversal pattern. We did see the Gap today and a moderate reversal in price. But the SPY, as usual, continued to try to melt upward.
I highlighted a very interesting TWINNING pattern in Bitcoin in this video. Pay attention.
Get some.
#trading #research #investing #tradingalgos #tradingsignals #cycles #fibonacci #elliotwave #modelingsystems #stocks #bitcoin #btcusd #cryptos #spy #gold #nq #investing #trading #spytrading #spymarket #tradingmarket #stockmarket #silver

SPY Prediction (with 10% conviction)Now that we are at ATH, whats going to happen next?
Superimposition of 2018 bear market over today's timeline shows we rally to $625 after which we get a correction to $573. Rally continues onwards until we get another plandemic🤞
In 2018 we had tariffs 1.0 in addition to FED QT. This time we have tariffs 2.0 (or do we?) and a confused FED which probably makes the case for the same level of FUD.
Economic and political environment changes but human behoviour does not change, altlest not like moores law.
Thank you for your attention to this matter!

SPRIAL TURN MAJOR JULY 5to the 10th TOP 4 spiral and one FIBThe chart posted is the updated chary for SPY SPIRAL calendar TURN Notice f12 is a spiral from July 16th 2024 top F 10 is from 11/2024 DJI The SPY was 12/5 th TOP F8 is from Feb 19th Top They ALL have a focus point on JULY 5th to 10th 2025 it is also 89 days since the print low. I Am looking for a MAJOR World event into this date . This time I feel it will be something with JAPAN . As to the markets here The put/call is now at the same level as july 2023 top and july 2024 . I have had fib targets in cash sp 500 from 6181 to as high as 6331 we are now in the middle of the targets But Time still has 3 to 5 days .So if we close strong today I will be buying deep in the money puts once again . The QQQ have entered the min target 551/553 But I tend to think {HOPE] we can reach 562 plus or minus 1.5 to move to a full short . But now in cash BTW the SMH target 283/285 is also a target .for its TOP Bitcoin is now setup for the next TOP I just need a new high .Best of trades WAVETIMER

How I screen for long term investmentsIn this video, I’ll show you the exact stock screener I use to find long-term investment opportunities — the kind of stocks you can buy and hold for years.
I’ll walk you through the key metrics to look for, how to use free tools like TradingView screener, and what red flags to avoid. This strategy is perfect for beginner and experienced investors who want to build long-term wealth, not chase hype.
Whether you're looking for undervalued stocks, consistent compounders, or just trying to build your long-term portfolio, this screener can help.
Hope you enjoy!!

SPY Stuck at Gamma Ceiling! Will Bulls Break 619 or Get Rejected Again? 🎯
🔍 GEX Option Flow Outlook
SPY is grinding right under the heavy call wall at 619, which aligns with the highest NET GEX resistance zone. The flow is dominated by calls, and GEX is flashing 4 green dots, meaning dealer hedging could drive price higher if 619 breaks cleanly.
* GEX Resistance Wall:
* 🔹 $619–$620 = stacked resistance (Call Wall + GEX7 + GEX8 + GEX9)
* 🚫 Historically acts like a magnet & rejection zone
* GEX Support Wall:
* 🔸 $614 = HVL support (strong bounce zone for 0DTE plays)
* 🔻 $610–$608 = Put Wall danger zone
💡 Based on the current GEX map, if bulls can break above 619 with volume, the path to 623 opens. But failure to do so likely triggers a pullback to 614.
🧠 Smart Money Price Action (1H Chart)
SPY remains in a bullish rising channel, printing higher lows. However, price is stuck inside a CHoCH zone (consolidation under resistance) right under the 619 level.
* BOS from June 27 confirms structure shift
* CHoCH zone holding short-term price action
* 📦 Demand zone: 615–614 → where bulls stepped in before
* Volume dropping = market waiting for catalyst
🎯 Trade Setups:
📈 Bullish Breakout Plan:
* Trigger: Above 619.50 with momentum
* Target: 621 → 623
* Stop: Below 617.50
* Trade Idea: Buy 620C or 622C (0DTE/1DTE) for a quick breakout scalp
📉 Bearish Rejection Plan:
* Trigger: Rejection below 619 with spike in volume
* Target: 614 → 610
* Stop: Above 620
* Trade Idea: Buy 615P or 612P (1–2 DTE) on failed breakout
🧠 My Take:
SPY is at a critical pressure point. If dealers are forced to hedge more delta due to call buying, we could see a breakout. But the Gamma Wall at 619 is real — bulls must break it with force or risk another fade.
Disclaimer: This is not financial advice. For educational purposes only. Always manage your risk. 🎯

Nightly $SPY / $SPX Scenarios for July 3, 2025🔮 Nightly AMEX:SPY / SP:SPX Scenarios for July 3, 2025 🔮
🌍 Market-Moving News 🌍
📉 U.S. Private Payrolls Surround Weakness
The ADP report showed a drop of 33,000 private-sector jobs in June, the first decline in over two years, reflecting businesses holding back hiring amid trade uncertainty. However, layoffs remain low, signaling no acute stress yet
📊 Markets Braced for NFP Caution
Markets are wary ahead of this morning’s Non‑Farm Payroll (NFP) release—currently projected at +115,000 jobs and 4.3% unemployment—based on indications of labor-market cooling from weak ADP numbers
💵 Canadian Dollar Strengthens
The loonie jumped 0.4% as investors adjust expectations for broader central-bank dovishness, driven by the weak U.S. jobs signals and optimism over a revived U.S.–Canada trade dialogue
📊 Key Data Releases 📊
📅 Thursday, July 3:
8:30 AM ET – Non‑Farm Payrolls (June):
Forecast: +115,000; Previous: +139,000 (May). Watching for signs of sustained job-growth slowdown.
8:30 AM ET – Unemployment Rate:
Forecast: 4.3%, up from 4.2% in May. A rise may increase odds of rate cuts.
8:30 AM ET – Average Hourly Earnings (MoM):
Forecast: +0.3%; prior: +0.4%. Cooling wages would ease inflation pressures.
8:30 AM ET – Initial & Continuing Jobless Claims:
Track week-to-week stability or worsening of labor-market conditions.
9:45 AM ET – Services PMI (June, flash):
Monitor for signs of slowing in U.S. service-sector activity.
10:00 AM ET – ISM Non-Manufacturing PMI (June, flash):
Forecast: 50.8. A reading below 50 suggests contraction in services.
⚠️ Disclaimer:
For informational and educational purposes only. It does not constitute financial advice. Consult a licensed financial advisor before making investment decisions.
📌 #trading #stockmarket #economy #jobs #Fed #labor #technicalanalysis

Nightly $SPY / $SPX Scenarios for June 27, 2025🔮 Nightly AMEX:SPY / SP:SPX Scenarios for June 27, 2025 🔮
🌍 Market-Moving News 🌍
📉 Global Markets Bet on Dovish Fed Pivot
Markets are pricing in more aggressive Federal Reserve rate cuts—approximately 125 bps by end-2026—due to speculation that President Trump may replace Chair Powell with a dovish successor. Investors caution excessive political influence could jeopardize Fed independence
🏦 Fed Governor Warns of Tariff Risks
Fed’s Michael Barr emphasized that tariffs could trigger inflation and unemployment, reinforcing the Fed’s wait‑and‑see approach. Expect modest rate cuts later this year, contingent on economic signals
📉 Q1 GDP Revised Sharply Lower
First-quarter U.S. GDP was downgraded to an annualized contraction of 0.5%, a deeper fall than previously reported. The revision underscores drag from weak consumer spending and trade disruptions
📃 Trade Deficit Widens in May
U.S. goods trade deficit expanded 11% to $96.6 billion, driven by a $9.7 billion drop in exports. Trade gap dynamics remain a headwind for growth projections
🐘 JPMorgan Sees Stagflation Risks
JPMorgan revised its U.S. GDP growth forecast down to 1.3%, warning that tariff-related “stagflationary impulse” is complicating growth and inflation outlooks—and making recession risks more real
📊 Key Data Releases 📊
📅 Friday, June 27:
8:30 AM ET – U. of Michigan Consumer Sentiment – June (Prelim.)
Expected to reflect growing economic caution. The index fell in May; traders will watch for further weakness.
10:00 AM ET – Fed Stress Test Results
Fed to release annual bank stress-test outcomes. Strong results support financial stability, while weak spots could unsettle markets
⚠️ Disclaimer:
This information is for educational and informational purposes only and should not be construed as financial advice. Always consult a licensed financial advisor before making investment decisions.
📌 #trading #stockmarket #economy #Fed #inflation #macro #charting #technicalanalysis

SP500 approaching rising trendline from belowThere has always been some correction when the market approaches the rising trendline from below. AMEX:SPY has about 10 point and SP:SPX about 100 points to go still. The volume is still on the buy side. I expect that to fade before a correction. Some market leaders like AMZN have already touched that trendline

$SPY Review of 6.30.25Yesterday’s price action was flat near previous ATH’s for the first part of the day and then the second part of the day we had some nice volatility that tapped the top of the implied move at 619 and then pulled back.

Stock Market Forecast | TSLA NVDA AAPL AMZN META MSFTStock Market Forecast | CME_MINI:NQ1! CME_MINI:ES1! QQQ SPY
Mag 7 Forecast | CBOE:MAGS NASDAQ:TSLA NVDA AAPL AMZN META MSFT

Nightly $SPY / $SPX Scenarios for July 1, 2025 🔮 Nightly AMEX:SPY / SP:SPX Scenarios for July 1, 2025 🔮
🌍 Market-Moving News 🌍
📊 Core Inflation Edges Higher
May’s core inflation rose unexpectedly to 2.7% year-over-year, up from 2.6%, casting uncertainty over the Fed’s timeline for rate cuts. While headline CPI sits at 2.3%, the resilience in underlying prices complicates policymakers’ projections for later this year
💵 Weak Dollar, Rising Rate-Cut Bets
Markets are reacting to “summertime data”—like the core CPI uptick—with renewed optimism. Traders now see up to 75 bps in Fed rate cuts later this year, while the dollar remains near 3½-year lows on concerns about Powell’s independence and trade developments
🇨🇦 U.S.–Canada Trade Talks Resume
Trade talks between the U.S. and Canada restarted today, following Ottawa’s suspension of its digital-services tax. Progress toward a broader agreement could reduce tariff risk and offer further relief to risk assets
📊 Key Data Releases & Events 📊
📅 Tuesday, July 1:
All Day – U.S.–Canada Trade Talks
Markets will watch for updates on tariff resolution and broader trade deals. Any breakthrough could notably boost equities and improve trade sentiment.
10:00 AM ET – ISM Manufacturing PMI (June)
A below-50 reading again would reinforce the narrative of industrial weakness. A rebound could support equities and temper recession concerns
10:00 AM ET – JOLTS Job Openings (May)
Still at elevated levels (~7.39 million in April), this metric assesses labor-market resilience. A decline could shift rate-cut expectations.
⚠️ Disclaimer:
This is for educational and informational purposes only. It does not constitute financial advice. Consult a licensed financial advisor before investing.
📌 #trading #stockmarket #economy #news #trendtao #charting #technicalanalysis

Weekly $SPY / $SPX Scenarios for June 30 – July 3, 2025🔮 Weekly AMEX:SPY / SP:SPX Scenarios for June 30 – July 3, 2025 🔮
🌍 Market-Moving News 🌍
📈 US Stocks Rally to Record Highs
Following a volatile first half, U.S. equities surged into record territory in late June on a combination of easing Middle East tensions, cooling inflation data, and the 90-day tariff pause
💵 Dollar Weakens on Fed and Trade Uncertainty
The U.S. dollar fell to a 3½-year low, pressured by persistent speculations over President Trump replacing Fed Chair Powell and extending rate-cut expectations, as well as progress in U.S.-Canada trade talks
🇨🇦 U.S.–Canada Trade Talks Lift Sentiment
Canada temporarily repealed its digital services tax to facilitate talks seeking a broader trade agreement by July 21, boosting U.S. equity futures
🛢️ Oil Prices Stabilize
After spiking on geopolitical fears, oil traders settled between $65–78/bbl amid supply relief following ceasefire developments and easing Middle East risks
⚠️ July Risks Loom
The coming week will spotlight:
July 4 deadline for Trump’s tax bill
Expiry of the tariff pause on July 9
U.S. Nonfarm Payrolls on July 3
Each poses potential for increased volatility if outcomes disappoint
📊 Key Data Releases & Events 📊
📅 Monday, June 30
9:45 AM ET – Chicago PMI (June): Gauge of Midwestern factory activity
📅 Tuesday, July 1
U.S. markets open, watch trade developments
📅 Wednesday, July 2
Global PMI readings released
📅 Thursday, July 3 (Early close ahead of Independence Day)
8:30 AM ET – Nonfarm Payrolls (June)
8:30 AM ET – Unemployment Rate (June)
8:30 AM ET – Average Hourly Earnings (June)
These labor metrics will be critical for Fed rate outlooking
⚠️ Disclaimer:
This information is for educational and informational purposes only and should not be construed as financial advice. Always consult a licensed financial advisor before making investment decisions.
📌 #trading #stockmarket #economy #jobs #Fed #oil #trade #technicalanalysis

SPY the pattern was there I missed it.THe chart will always show you what it wants to do. You have to see it.
