Trading Idea: Range Breakout StrategyBias: Neutral-to-Bullish (for breakout)
Setup:
SPY is consolidating between $520–534. A clean break above this zone could signal continuation toward the pivot level at 562.75.
Entry Options:
Aggressive Long:
Buy near current levels (~526), stop-loss below $520, target $534 short-term and $550–562 swing target.
Conservative Long (Breakout):
Buy above $534, on confirmed breakout with volume. Stop-loss just below $528. Target: $548–562.
Bearish Scenario (if breakdown):
If price falls below $520 with strong red volume, potential retest of $511 support and further down toward $500 or $480 (S2).
Short entry below $520, stop-loss at $526, target $511 then $500.
Volume Insight:
Strong green bar at bounce near $480 indicates buyer interest.
Current candles show indecision; breakout or breakdown will likely be volume-driven.
disclaimer: The trade idea presented is for educational and informational purposes only and should not be considered financial advice.
SPY trade ideas

SPY Trading Opportunity! BUY!
My dear subscribers,
My technical analysis for SPY is below:
The price is coiling around a solid key level - 526.40
Bias - Bullish
Technical Indicators: Pivot Points High anticipates a potential price reversal.
Super trend shows a clear buy, giving a perfect indicators' convergence.
Goal - 554.18
My Stop Loss - 512.11
About Used Indicators:
By the very nature of the supertrend indicator, it offers firm support and resistance levels for traders to enter and exit trades. Additionally, it also provides signals for setting stop losses
———————————
WISH YOU ALL LUCK

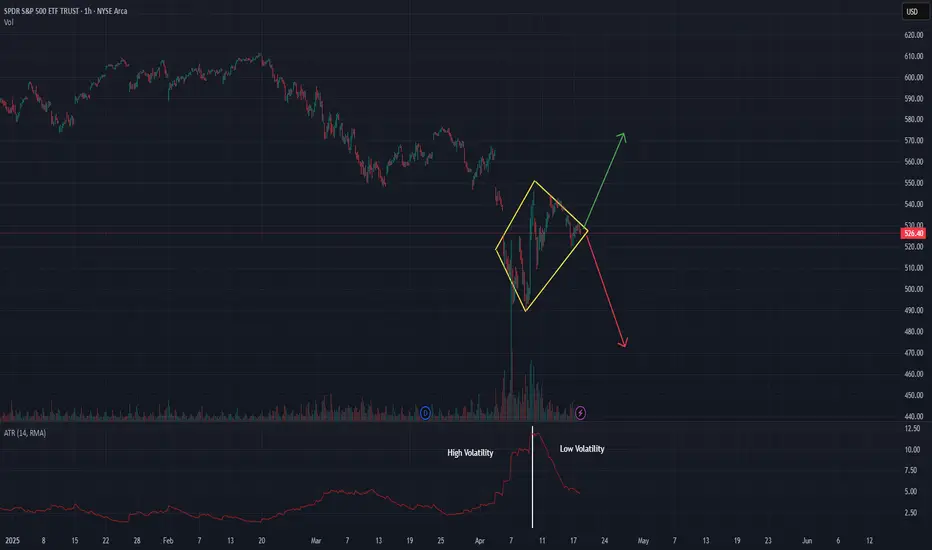
SPY forming an ugly diamond bottom: Big move soonDecided to just ignore all the noise and go back to the basics for this one.
We got a classic ugly diamond bottom, a ton of volatility after a large price move followed by reduced volatility, some symmetry but there are bits that pop out of the pattern on both sides.
Diamonds don't have to look perfect for them to be legit, this one is certainly no beauty and I was hesitating to call it one, but I think it is close enough.
Measured moved for each side is 570 (up to the liberation day announcement) if there is a positive breakout, and 470 down to the next level of support if there is a negative breakout.
Volume is declining from when we entered the diamond shape, which typically points to a bullish breakout. If we get positive tariff news this could definitely happen.
Ultimately watch for a break of 520 for a bearish move and a break of 536 for a bullish move.
SPY Trendlines I've Been EyeingHard to tell how the market will move always, seems like we will be heading into a bear market, but realistically who knows, we could be ready to bounce up back into a bull market on a whim. I've been trading lately based off daily price action and volume.

Double bottom on SPY would be nice.I'm thinking that if SPY does a double bottom around 4800, it could be a good time to buy. I don't think SPY will drop below 4800 because Trump seems to be working on positive news with Ukraine/Russia, the Iran deal, Japan, and so on. If we hit 4800 again, it would probably mean the Fed isn't cutting rates, Powell gets fired, or some big tech companies miss their earnings. But Trump will probably try his hardest to lift the markets from here, and 5000 could be a higher low.

SPY: Happy Easter! Week of April 20Hey everyone,
Back for the next week!
Just sharing my thoughts.
And as promised here are the levels to reference
Happy easter and safe trades to all! 🐰

Stock Market Forecast | TSLA NVDA AAPL AMZN META MSFTStock Market Forecast | NASDAQ:QQQ AMEX:SPY
Mag 7 Forecast | NASDAQ:TSLA NASDAQ:NVDA AAPL AMZN META MSFT

Bottom this summer!AMEX:SPY has a constant repeating pattern when making new highs! Looking back at previous retracements you can see that they tend to have a common length and drawdown percentage.

$SpyI think we head to 510 next week and most likely lower...
Here's vix
2hour chart (Log)
Pennant here showing. My price target next week is 45. Fire works over 35
AMEX:SPY daily RSI
Rolling over here at resistance
Spy daily chart
Pennant resistance trendline at 21ema is at the same spot 540 ish.. if price can close over that before a break below 520 then this correction has taking a break and we will likely head to 547 and over that 565
Ixic (Nasdaq)
Same analysis as Spy
I'll update this more over the weekend but I just wanted to get this out there before the close.... Any longs are risky below the 21/20 moving averages

Are US Tariffs Similar To The COVID-19 Global DisruptionThis video is in response to a question asked by one of my followers on TradingView.
He specifically asked if the current US Tariffs create a similar situation to the COVID-19 supply disruptions and how it may result in longer-term market disruptions.
In this video, I try to answer these questions and highlight the differences I see related to what is happening now vs. the COVID-19 shutdown.
It is an interesting question.
I certainly see similarities, but I also see vast differences in terms of how the global markets are attempting to address the US tariff issues.
First, the current tariff issues are somewhat self-inflicted, not something like COVID-19 (unavoidable).
Second, the global central banks acted in concert to present immense liquidity to support a global shutdown with COVID. I don't see that happening right now.
Supply-side disruptions are evident, but we'll see how they play out over the next 60- 90+ days.
Longer-term, I hope these tariff issues are resolved before the global economy moves into a deeper recession. I will state that hard assets are likely to take a hit over the next 60-90+ days across the globe.
Any moderate (think 15 to 35%) slowdown in production, shipping, and consumption across the globe is going to be felt all over the planet. It is not going to be isolated to just one or two areas.
This is the smackdown that I don't believe anyone is really ready for. And that creates the urgency to resolve the tariff issues asap.
Hope this helps.
Get Some.
#trading #research #investing #tradingalgos #tradingsignals #cycles #fibonacci #elliotwave #modelingsystems #stocks #bitcoin #btcusd #cryptos #spy #gold #nq #investing #trading #spytrading #spymarket #tradingmarket #stockmarket #silver

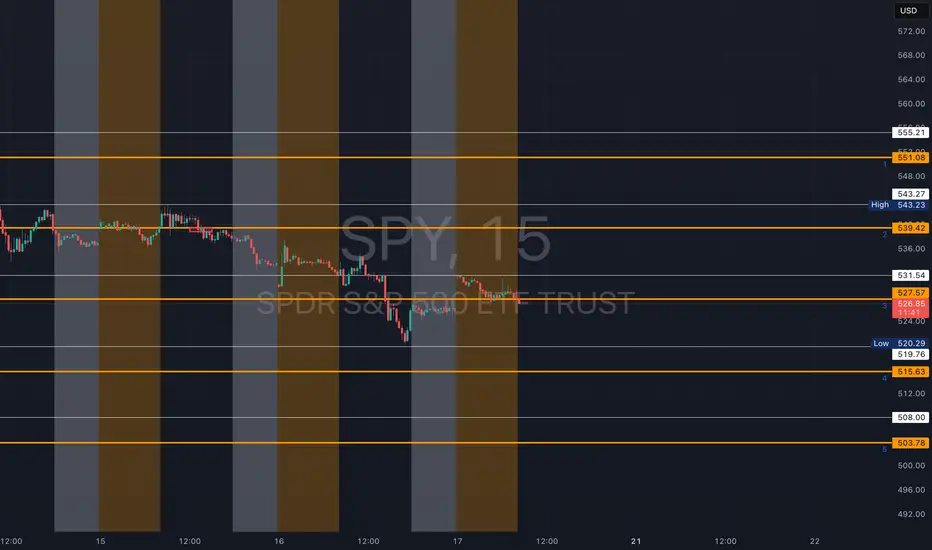
SPY - support & resistant areas for today April 17 2025These are Support and Resistance lines for today April 17 2025 and will not be valid for next day. Mark these in your chart by clicking grab this below.
Yellow Lines: Heavily S/R areas, price action will start when closing in on these.
White Lines: Are SL, TP or Mid Level Support and Resistance Areas, these are traded if consolidation take place on them.
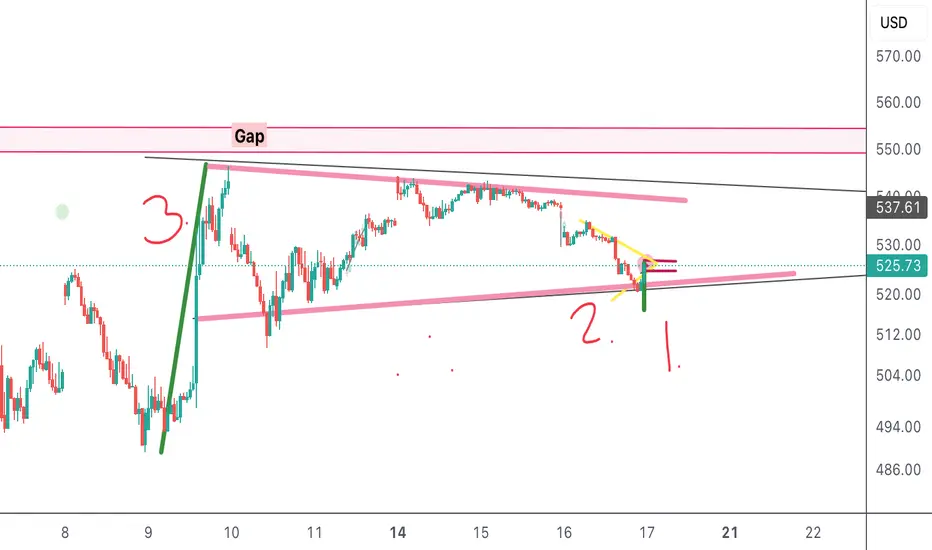
Bulls held the line!boost and follow for more 🔥
In my last SPY analysis I pointed out the potential short trap below major support, I added back all shares and some shortly after I noticed this when spy was around 490.
I think as long as 523 holds then a push higher to 550-570 can happen in the next few weeks.🎯
first and last chart from me today, I hope you all have a great weekend 🤝

$SPY April 17 2025Not much to share. I am waiting for a base between 480 to 530 to form. Maybe 1 or 2 weeks.
Till then i will watch. No set ups

SPY/QQQ Plan Your Trade Video For 4-17 : Another BLANK dayToday's BLANK pattern in counter-trend mode is nothing to worry about.
As I research and document these patterns, there are patterns that appear frequently on the Daily price chart and there are others that appear more infrequently.
If I have not already marked these patterns and documented them, they have not appeared anywhere in the 11+ years of the Daily price data I use within the Lookup Engine.
Therefore, these are VERY RARE types of patterns - Extremely infrequent.
I will add that the secondary looking criteria show yesterday and today could be similar to "key top/bottom" types of price rotation. So, I do believe the current price level on the SPY (520-535) could prove to be very critical support/resistance going forward.
Tomorrow is Good Friday (no trading). So if you are going to take any trades today, make sure you remember to plan your exits for TODAY or NEXT WEEK (or later). You will not be able to exit stock/ETF trades tomorrow (sorry).
Gold is moving into a Momentum Rally, and I really want to see how that pattern plays out before the long holiday weekend.
Fingers crossed we see a BIG RALLY again today.
BTCUSD is still rolling into a downward price trend based on my EPP pattern structure. This downward trend aligns with my May 2 Major Bottom pattern for the SPY/QQQ. So I would expect BTCUSD to start to roll downward sometime near the middle/end of next week.
Remember, this weekend should be about your family, your friends, and your beliefs.
Relax and enjoy.
Get some...
#trading #research #investing #tradingalgos #tradingsignals #cycles #fibonacci #elliotwave #modelingsystems #stocks #bitcoin #btcusd #cryptos #spy #gold #nq #investing #trading #spytrading #spymarket #tradingmarket #stockmarket #silver #xauusd

April 17, 2025 - Powell, Japan & TrumpHello everyone, it’s April 17, 2025. Yesterday’s U.S. trading was pure market carnage. Semiconductors ( NASDAQ:NVDA , NASDAQ:AMD , NASDAQ:ASML ) were steamrolled as AI chip bans to China kicked in and Trump dropped another tariff bomb, hiking duties to 245%. That wiped $200 billion off Nvidia alone.
In Chicago, Powell stoked the flames, warning tariffs will fuel inflation and choke growth, and insisted he’s in no rush to cut rates. The CME_MINI:NQ1! tumbled 3%, the CME_MINI:SOX1! lost 4.1%, and bond futures plunged.
This morning, U.S. futures are up about 0.75% on headlines that Trump’s talks with Japanese negotiators are “going very well,” sparking rallies across Asia: Nikkei +1%, Hong Kong +2.7%, Shanghai +1%. It seems even a whiff of détente with Japan sends everyone scrambling back into risk assets.
On commodities, BLACKBULL:WTI jumps to $63.35 amid fresh U.S. sanctions on Iran and OPEC output cuts; OANDA:XAUUSD rockets to $3,352 /oz; INDEX:BTCUSD hovers near $83,500.
Today watch the ECB’s rate cut, Powell’s next speech, Philly Fed and jobless claims before the Good Friday shutdown. With Trump’s erratic tariff theatrics and Powell’s warning of higher inflation and slower growth, volatility is set to reign supreme. Buckle up.

$SPY Recap of April 16 2025Awesome drop all the way down to the bottom of the implied move.
The spreads I suggested in last night's video filled at the end of the day and closed up 100% 🙌🏼
Let's do it again tomorrow!!

SpY...BULLISH (for now)High and tight flag on nearly every time horizon....Today's price action foreshadowed---the rare pattern was popping off like firecrackers---but here comes the roman candle. I think it's one last bull run before we do a bit more correcting....
Bulls and Bears Oh myhmmm up to test resistance. Possibly fill the 550ish gap if it goes a little wild... head and shoulders also on the table

Nightly $SPY / $SPX Scenarios for April 17, 2025🔮 🔮
🌍 Market-Moving News 🌍:
🇪🇺 ECB Expected to Cut Rates Amid Trade Pressures: The European Central Bank is anticipated to reduce its deposit rate by 25 basis points to 2.25% during its meeting on April 17. This expected move aims to counteract the economic impact of recent U.S. tariffs and a strengthening euro, which have contributed to disinflationary pressures in the eurozone.
📉 German Inflation Decline Supports Easing: Germany's inflation rate fell more than expected in March, dropping to 2.3% from 2.6% in February. This decline, driven by falling oil prices and a sluggish economy, bolsters the case for further interest rate cuts by the ECB.
🤖 AI Enhances ECB Policy Predictions: A study by the German Institute for Economic Research indicates that artificial intelligence significantly improves the accuracy of forecasting ECB monetary policy decisions. By analyzing ECB communications, AI models can better anticipate policy shifts.
📊 Key Data Releases 📊
📅 Thursday, April 17:
🏠 Housing Starts (8:30 AM ET):
Forecast: 1.420 million
Previous: 1.501 million
Indicates the number of new residential construction projects begun, reflecting housing market strength.
🏭 Philadelphia Fed Manufacturing Survey (8:30 AM ET):
Forecast: 3.7
Previous: 12.5
Measures manufacturing activity in the Philadelphia region, providing insights into sector health.
📈 Initial Jobless Claims (8:30 AM ET):
Forecast: 223,000
Previous: 223,000
Reports the number of individuals filing for unemployment benefits for the first time, reflecting labor market conditions.
⚠️ Disclaimer: This information is for educational and informational purposes only and should not be construed as financial advice. Always consult a licensed financial advisor before making investment decisions.
📌 #trading #stockmarket #economy #news #trendtao #charting #technicalanalysis

SPY CRACK! WARNING!We are in the "honey" phase in Stocks.
This is the part where they tell you:
-Don't panic
-Stocks are cheap forward EPS
-Nible on the way down
-Diversified portfolio wins..
-It's a stock picker's market
-There is a lot of cash on the sidelines
-It's just a reset
-It's a correction
-We needed this to shake out the weak hands
-Buy when there is blood in the streets, even if it's yours
-There is a lot of value in...
-This is your last chance to...
-This and that stock are going to $1,000
-Stocks are the best investment over the course of time
The list is endless to get you to buy or stay in and suck up the pain. They will "Future Fuke" you the world.
I will remind you that you cannot buy unless you first sell! No one has endless money, and your 1% addition monthly will not lower your cost basis.
All I can tell you is what this chart shows! A BIG CRACK!
WARNING!!!
Click like, follow, subscribe, and let me help you navigate these crazy markets.

Non-US ETFs outperform during trade warNon-US markets are showing resilience during this year's remarkable volatility.
While NASDAQ:QQQ and AMEX:SPY are down more than 10%, AMEX:VEA (non-U.S. Developed Markets ETF) is up nearly 5%...
AMEX:IEMG (tracking Emerging Markets) is negative so far, but less severe than others. Will Trump's volatile trade war lead to further outflow from the U.S. financial system?
Meanwhile, gold has been rallying to record highs as the world seeks an alternative to the dollar.

A break back above 530 could trigger a move toward 550Look for a strong move higher if the market breaks back above 530. Currently falling on below average volume and could see the market recover abruptly.

Down likely continuesWe had a short squeeze this morning, but the wave now looks like a C down to 521 or 512 on AMEX:SPY
