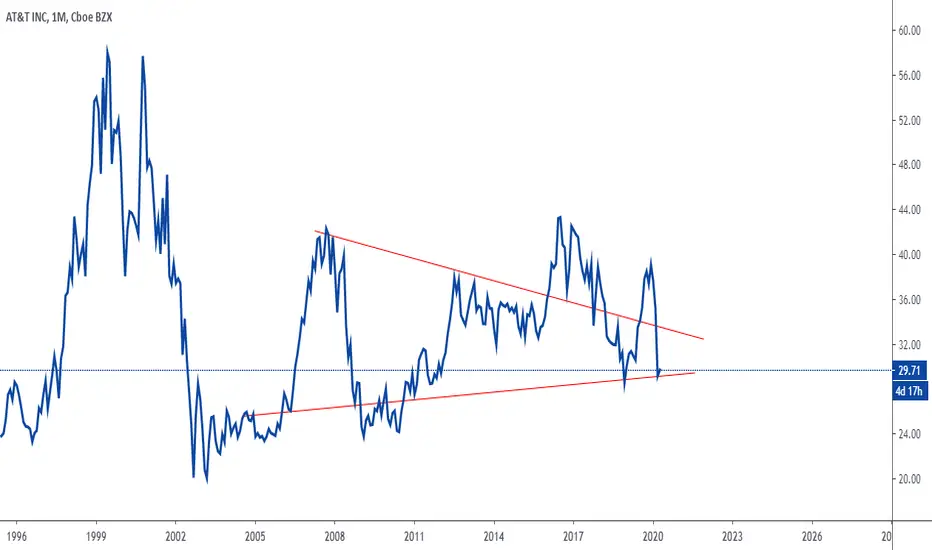
$T - one for the port$T - nice break of the descending wedge, but was unable to close over 29.70 resistance.
T trade ideas


AT&T More Down Side to Come (Revised)AT&T (NYSE: T)
What is AT&T:
Is a telecommunications company that also provides mobile phone Services along with Cable and Internet Services.
JesusTrades Score:
Sell
Scale Score:
Risky (7/10)
Portfolio Hold:
1 month
Fundamental Reasoning:
Last Earning Report (Pre-COVID) T reported an earning of less revenue than last year, less EPS and and a Loss on revenue. Short interest on T has been going up since 4/20 and believe more will come in when the market takes a dump.


ATT shorttrying something out,
idk how to code in pinescript yet, but I have some python code running to help me find big block orders.
Test 1/1

Multiple TimeFrame Analysis AT&TAT&T stock look likes it ready to make a huge move to the downside =.
It appears to have shown several sell signals, informing that there is a lot of bearish pressure.
I have analysis of several different time frames, like comment and follow.
I'm open to all differing opinions, maybe you see something I don't, if so feel free to drop a comment !

At&T weakness. AT&T had a strong sell-off on Friday close. Will wee see a strong continued sell down or will it rebound to 88.6% of the rising wedge for a grand sell-off?


Buy CALL for options or/and Buy shares as add ur passive income.Options: Buy CALL, your decide when expire date.
Stocks: Buy many shares as you wish. this is HIGH dividend % that AT%T company does payment $0.52 per a share! Its good time to buy largely shares because it will be your passive income dividend for living!

AT&T in a key area right now .NYSE:T is in a key area right now , what will happen tomorrow or the next few days is likely to give a clear idea about future price evolution .Either upwards to around the 37 mark ,or downwards .

Flag pattern and consolidation. Spring upT has not seen the bounce the rest of the market has enjoyed. I think it’s a sleeper about to break resistance upwards off of this flag pattern.

AT&T Topping Out Short TermAT&T (NYSE: T)
What is AT&T:
Is a telecommunications company that also provides mobile phone Services along with Cable and Internet Services.
JesusTrades Score:
Sell
Scale Score:
Risky (7/10)
Portfolio Hold:
1 month
Fundamental Reasoning:
Last Earning Report (Pre-COVID) T reported an earning of less revenue than last year, less EPS and and a Loss on revenue. Short interest on T has been going up since 4/20 and believe more will come in when the market takes a dump.

AT&Tllego a su punto mas bajo en diario, estamos en ondas correctivas, para empezar la tendencia alcista. Necesitamos confirmar la entrada mediante un giro de precio para que se consolide 4 para ir a buscar 5 en diario.

Which way will it go?If it closes monthly above that bottom red trend line, then its bullish otherwise lower prices to come in May.

Bull Trap, Short opportunity in a bear market rally$31 level still a strong resistance and it will reverse to retest the lows

ATT waiting for buy set up after the pullback t 50 and 61.8 fibo buy it but if the price goes up without pullback it will cancel entry .

AT&T - Multiple Top Resistance AT&T showing Multiple Top Resistance at the price $31 it should reverse down, and also showing head and shoulders pattern

AT&T retracementPrice has tested previous low and making doji to fill the gap before it drop providing previous swing high is not broken to make a lower swing high


AT&T: Good Short opportunities within the next weekScenarion #1.0: Short from current level or higher
Optimal price for S:1.0
Short price - $29.5;
SL - 31.3 (6.5%);
TP/Fix - 23.9 (19%).
P/R ratio - 3.0
P.S The following scenarios will be considered after the #1.0 is implemented - check an updates
Share your vision on this stock in comments below.

BOLLINGER BAND Indicator of VolatilityA Bollinger Band is a technical analysis tool defined by a set of lines plotted two standard deviations (positively and negatively) away from a simple moving average (SMA) of the security's price, but can be adjusted to user preferences.
Because standard deviation is a measure of volatility, when the markets become more volatile the bands widen; during less volatile periods, the bands contract.
