Target Price Prediction Looks like Target is bouncing off the support and off of the .5 retracement.
TGT trade ideas

$TGT- Target Corp - (Earnings Sell off & Wedge Example)3/2/21
$TGT- Target Corp - 6.771% Decliner
Catalysts:
1. What I have personally noticed that after earnings beats:
If earnings are not exceptional, you will often see a sell off where there is profit taking, shorts covering and shorts entering. Combined with the chopiness we saw this past week and today with SPY and QQQ, the sell off shouldn't have came as too much of a suprise. Price was able to recover somewhat later in the session.
2. Target chose to withdrew 2021 fiscal guidance, "in light of the highly fluid and uncertain outlook for consumer shopping patterns and the impact of COVID-19."
Not worrisome to most but something worth noting that definitely did not help the sell off we saw on the open.
3. Price was already in a downtrend and broke the lower trendline of wedge shown in chart. A bearish signal.
A bullish note:
I see Target as a great buy at this price. This was a solid earnings beat with an increase in revenue and sales and a beat on EPS.
Earnings highlights:
-Target's 2020 sales growth of more than $15 billion was greater than the Company's total sales growth over the prior 11 years.
-Comparable sales grew 20.5 percent in the fourth quarter, reflecting comparable stores sales growth of 6.9 percent and digital sales growth of 118 percent.
-Total revenue of $28.3 billion grew 21.1 percent compared with last year, driven by sales growth of 21.0 percent and a 28.7 percent increase in other revenue. -Operating income was $1.8 billion in fourth quarter 2020, up 53.2 percent from $1.2 billion in 2019.
Analyst are also bullish. The majority of analyst ratings are all upgrades and increase in PT's anywhere from $195-$230.
-I'm going to be taking a look at some of the top daily gainers (may throw in some losers occasionally) of the day on their daily charts and posting them here throughout March. This is not advice. Just analyzing price action and patterns.
-I will try to vary the catalysts (analyst upgrades, earnings, clinical trial results, etc.) for the stock moving (if any) and the sector that the stocks are in.
-You'll notice I try to keep my charts as simple as possible. Black background and no grid. I will be focusing solely on price action, patterns, and support and resistance levels.
No moving averages, MACD, volume profiles, Bollinger bands, etc.
Please feel free to comment or leave suggestions. I am always looking to improve. Thanks.

TGT Bull PennantTarget looking to tuck into a bull pennant formation for the next several weeks. Love the P/E, management, but today's price action broke through a fairly rock solid 1 year trend line. Will enter into a position before the weekend if it behaves as I suspect. Two entry levels, if the indices rally tomorrow, it might find support on it's flag base.


$TGT - long after ERAfter a solid ER and a nice chart. $TGT looks great to go long here.
ER Recap:
Target exceeded Wall Street’s expectations for the fourth quarter, thanks to a strong holiday season and stimulus checks.
[*}The company has gained market share with its e-commerce offerings and wide range of merchandise, as retail competitors temporarily closed and saw sales drop during the pandemic.
[*}Still, Target declined to provide a forecast for the year ahead, saying the pandemic has made it too difficult to predict consumer patterns.

$TGT - Easiest money ever.Just buy TGT at 185-ish and wait till it's near or above the bullish channel of the Pitchfork. Easiest money you'll ever make.
That's it. It's super easy.

Target about to rip & roar to the upside!This is a Daily chart of Target, currently in a very healthy uptrend.
The chart pattern i've drawn isn't exactly a cup & handle. You can argue that it's an inverted head & shoulder, although technically inverted head & shoulders pattern are usually a chart pattern to signify reversal from a downtrend. BUT I don't subscribe to the EXACT patterns, but more of the idea/ concept around chart patterns.
Whatever the case, price is currently at 20moving average and a weak down cycle (Stoch RSI hasn't reached oversold level), this signify to me that Target is about to surge up much higher.
Target profit 1 will be 200.
There's no Target profit 2 because there's no resistance/ ceiling.
Right now is a good time to buy in.
If you trade options, you can buy the At the Money strike with 2 weeks out (if you're aggressive) or 3-4 weeks out.
If you have a symbol that you'd like me to analyze, feel free to let me know in the comments!
Thanks!


TGT breakout heading into earnings From a TA standpoint, this is riding an uptrend since April and looking like a possible IH&S with desc wedge heading right into 3/2 earnings. On top of a weak WMT earnings where WMT noted a loss in market share recently, look for a run up into earnings banking on market share shifting to TGT. I believe new ATHs (204) will be tested in the coming weeks with all this considered

TGTTGT, with what looks like volatility is starting to contract. Will keep watching. Green on a very red day.

new highs for TGT soon! great dip entry her for tgt, chart speaks for itself really :D long 189 stop loss 181 and price target 208!


TGT Breakout WatchPrice is approaching the upper channel. If a breakout occurs it might be a good run up into earnings.
If its rejected with bad market conditions, it price could retrace to one of the two supports.


TGT to hit 210$?TGT has formed a channel pattern and is holding above 190$ for past few days.
Holding above this level, with the retail sales report coming in tomorrow and earning in March, it can test ATH 200 and can reach 210 to 220$.
NOTE: This is just a prediction and this cannot be taken as a trade advice!

$TGT 2/9/2021RSI is trending up from its previous Oversold bottom.
MACD has shown a Bullish sign
SQZ Mom is reversing from red
As well as it trading within its channel and potentially retesting its all time high very soon. bollinger bands also show support and resistance on the trend lines
Target has done well in the pandemic for its earnings beating expectations the past 4 times by a lot.
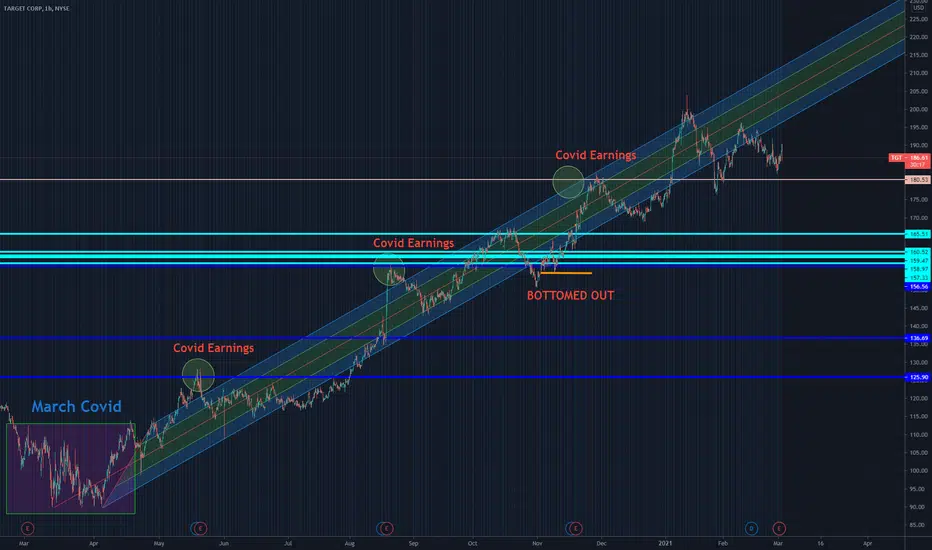
I think this trend continues. If Target can dip into the purple buy zone I will be looking at calls for March 5th 3 days after the earnings report.
about 4 weeks out
$TGT $197.5 C March 5th


Long TGTTarget recently having hidden bullish divergence on the daily RSI. Continuation in the channel with current target around $218/share.

TGT Channel & ER Run-upRetail hasn’t really been the play in the past couple of weeks but Target $TGT has proven itself to be a strong company throughout this COVID market. $TGT has been following the same strong support line since October, and has been holding the same trend line for the past year. $TGT hit its support on January 28th at the price of $178.01. Since then, it has pushed and closed at $188.86 on Friday February 5th. I alerted a position on Thursday for two 200 call contracts for March 19 expiry. Target has the upwards momentum and can see the levels of $190 then $194 and then a push to $200. Price target set at $200, could see this in the next one to two weeks - above that can run to 210-212 at the top of the channel.


TGT Inv HS??Might be a stretch but maybe an inverse HS on the hourly. Still strong though regardless.
