$TLT - Michael Burry's bet on inflationAs many traders have been made aware due to the 13F filings, Michael Burry is short on a lot of things. With over half of a billion dollars in TSLA puts, one might assume he wants the EV manufacturer burn but there's more to it than just that. Over 2020, to stimulate growth in the market and in the economy, the fed dropped interest rates to 0. While they didn't stay at 0 for long, the low rates were incredibly bullish for these growth centric companies. Think TSLA, ROKU, SQ, ZM, Cathie Wood, etc. Companies that are traditionally very OVER valued when looking at their P/E. These low rates enabled investors to price in years and years of growth ahead of schedule. Now, in 2021 the headline of the year has been INFLATION. Everywhere you look you see tech (with their inflated P/E ratios) crumbling, value stocks climbing, fear of dollars becoming worthless and pouring into commodities whether that's oil, lumber, crypto or metals.
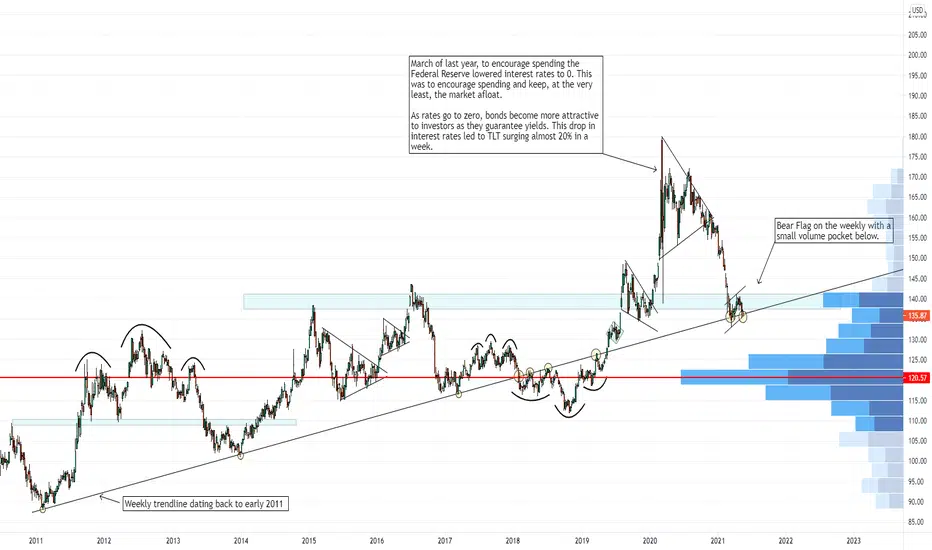
Michael Burry's true portfolio is not one directed at Tesla specifically, but one betting on inflation to catch up with us. While TSLA makes up a large portion of this position, he also has 170M in TLT puts and 55M in TBT Calls. Bringing his portfolio to a net position of roughly 760M in derivatives betting on inflation. Most interesting to me anyways is the TLT position. TLT runs inverse of the 10 and 30 year bonds. Last year as rates went to 0 to encourage spending, TLT shot up 18% in a week. This current climate of near 0 rates are fantastic for financing (because if you can lock in a 30yr mortgage for 3% and inflation is 3%, that's essentially borrowing money for free. For 30 years. While an asset appreciates), but the spending is not beneficial for the valuation of the dollar.
As of December 2020, nearly 35% of all US dollars in existence were printed in the 10 months prior. There are two ways in which a functioning market would pay for this, one would be increased taxes which have been proposed but not passed. The other is through inflation devaluing dollars and increasing relative cost of goods. The latter is much more expensive but generally goes under the radar. At some point the Federal Reserve will need to SLOW DOWN the the economy. The most likely way for this to happen is to raise interest rates making borrowing money more expensive.
From a technical point of view the US 10 year bond is bull flagging on a larger time frame, this is probably the most consistent bullish pattern and is line with the point of view of the Federal Reserve raising rates ahead of schedule. Conversely, TLT is bear flagging on the weekly, so there's no divergence there which is great for Michael Burry's analysis. In addition to TLT's bear flag, it's on the verge of breaking below a decade long support line it's followed and is on it's 200 day moving average.
Jerome Powell has stayed true to his word thus far and has, honestly, done quite well in keeping the market afloat and strong over the last 14 months or so. The real question is whether or not he was wrong in his assumption that rates can stay low for as long as he's promised and if inflation is truly under their control.
Warwick, OptionsSwing Analyst
TLT trade ideas
$TLT when Burry shorts...It's time to rethink my calls...not that one person is always right, but it would be dumb not to consider it. Going to likely pull out of my calls tomorrow...


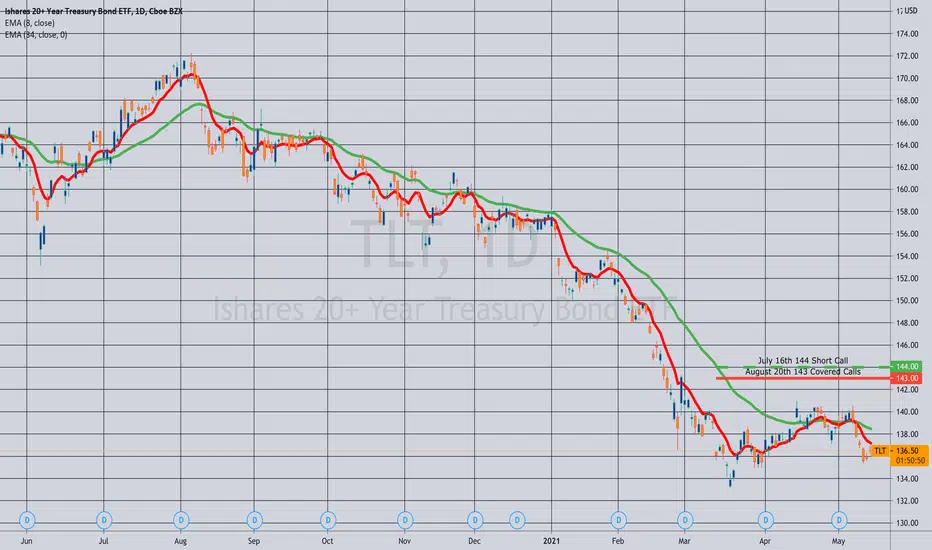
Rolling (IRA): TLT July 144 Covered Calls to August 143... for an .80/contract credit.
Notes: With the 144's at 50% max, rolling out and down to the 28 delta strike in August. Total credits collected of 7.93/contract (See Post Below) versus a short call value of 1.61 = realized gain of 6.32 so far. I last acquired at around 110/share, so am fine here with being called away (even though I don't think that's going to happen). Similarly, I'm fine with collecting short call premium + the dividends, which are nothing to write home about -- the May 3rd dividend was a whopping $20.31 per one lot.
Long Term Bond Prices FallingWe have break out of what appears to be a bear flag on TLT today. Next level of support after this break up appears to be around $128 and $122.
CPI report today confirms fears of inflation, thus bonds prices will fall and yields will rise.


The Bond Bear Market is just beginning!The Bond Market will continue to sell off as this inflationary cycle continues! These are my next target but I think this is just the beginning.

TLT20 sma crossed the 50 sma last week. Keep an eye on bonds early this month. Wouldn't be surprised to see a 100 sma test sometime in May. Inverted h&s target around $146 if above $140.

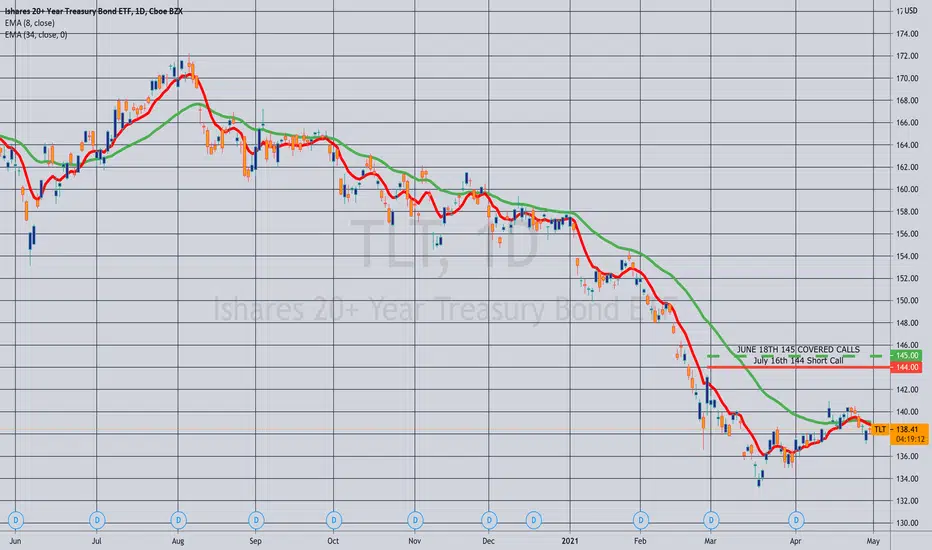
Rolling (IRA): TLT June 18th 145 Calls to July 144... for a .71/contract credit.
Notes: A continuation of my TLT covered calls (i.e., shares of stock + short call). (See Post Below). With the 145's converging on 50% max, rolling out to the July 144's (28 delta) for a .71/contract credit. Total credits collected of 7.13 versus a short call value of 1.49 = realized gains of 5.64/contract so far on the short call premium end of the stick since December.
Rates down...FED sets lowerFED is setting low rates, its a short market. So dont buy 'on price'. Weekly charts shows a pretty clear setup.
I am not personally shorting, but that is a matter of capital placement including returns in crypto.


20 YR Bonds, Interest at these levelsLooks like investors are slowly but surely moving into safe assets such as bonds as we have currently hit bottom and can see some slow consolidation before a breakout.

TLT - Monthly pivot break upAre they going to try and bust this through the Monthly Pivot (white line)?
Lets see...

a hedge to taxes what to do with a %43.3 capitol gains tax
buy nontaxable assets like government bonds
when the demand for those bonds goes up so will TLT
this is on the weekly and the MACD and RSI both look like it is time to go long
when big money catches on to this method the options chain can go crazy

Stocks To Watch 21/04/2021These are the stocks that I'm looking at for tonight open.
Shorting AAPL below 135 Strike
Shorting HD below 340 Strike
Shorting TGT below 220 Strike
Buying TLT above 138 Strike

TLT is about to resume the down-trendDown-trend on TLT is about to resume with a target around 122, so I am excepting long side of a yield curve to go event further up and eventually exceed 3%. I like Lacy Hunt's arguments for deflation/not inflation in the long term. But as he also mentioned, it is a norm at the moment to expect a short term inflation pressure.
I believe a 5 wave structure is unwinding since 5th of April, 2020 on TLT chart, with 4th wave potentially just completed. Wave 2 had triangle structure, so wave 4 is expected to form a zig-zag , exactly is it actually happened. So it is ready for the next move down towards 122.
Watch TLT/JNK chart which I found very interesting, it gives an idea about a turning point when market is going to turn from risk to save assets. Most likely it will be in sync with completion of DXY correction (started in 2017), so both $ and bond will go up after then.

TLT Bouncing -- Yields ? DXY ? Gold ? Equities? This potential bounce in TLT could be big shift for market. Bonds inverse yields.

Treasury Bond ETF Smashes Into 50-day SMABonds have bounced in the last month, but now the bears may be coming back.
The iShares 20+ Year Treasury Bond ETF jumped to its 50-day simple moving average (SMA) yesterday. It was the first test of the SMA since the beginning of the year.
Second, TLT moves in the opposite direction as the CBOE 30-year Treasury Bond Yield Index (TYX). Yesterday it held an upward-sloping trendline that began on January 4. Also notice how a kicker candlestick pattern may be taking shape, with a quick bounce from the low:
Finally, yesterday’s data could favor more downside in TLT because initial jobless claims, retail sales and Fed surveys suggested the economy is rebounding sharply. The numbers were so strong that the Atlanta Fed’s GDPNow estimate for Q1 growth was revised up from 6.2 percent to 8.3 percent.
TradeStation is a pioneer in the trading industry, providing access to stocks, options, futures and cryptocurrencies. See our Overview for more.

Running into resistance soon.TLT has been walking up this trendline since about mid March but watch out, the pink line is a well established longterm trend that could prove to be major resistance. If that trendline holds we could see a reversal in bonds which would cause a rise in rates.

$TLT Suddenly in Bullish Setup as CPI, Auction Avoid DisasterDon't look now but long bonds are suddenly pressing the top of a bullish ascending triangle after a strong 30-year auction.

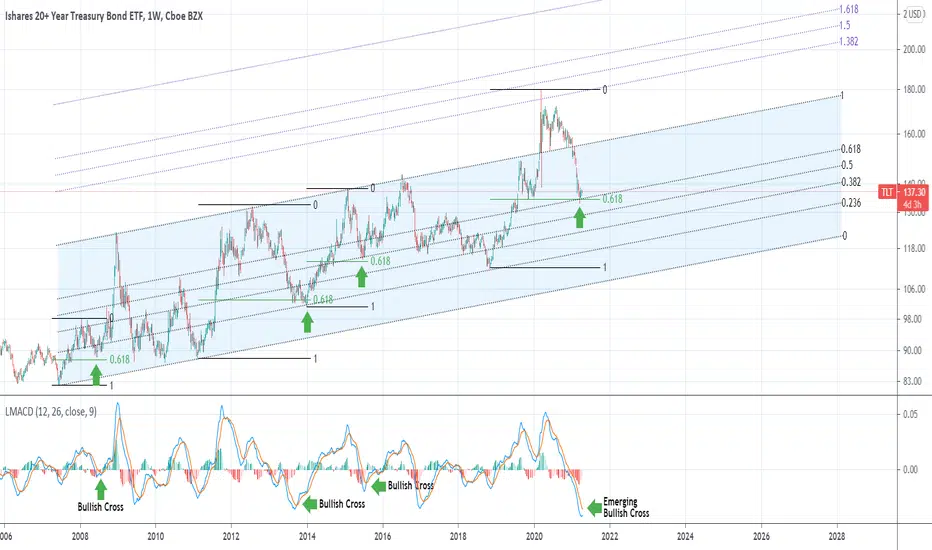
TLT Best buy for at least one yearThis chart shows a very clear and strong trend on TLT on a multi-year basis. Every time the price hits the 0.618 Fibonacci retracement level (1W time-frame), it finds a long-term Support and rises. This is accompanied by a MACD Bullish Cross. See who the Channel's Fibs are also playing their role as Supports. Can this be the new long-term Support in TLT's attempt to break above the 1.5 extension?
** Please support this idea with your likes and comments, it is the best way to keep it relevant and support me. **
--------------------------------------------------------------------------------------------------------
!! Donations via TradingView coins also help me a great deal at posting more free trading content and signals here !!
🎉 👍 Shout-out to TradingShot's 💰 top TradingView Coin donor 💰 this week ==> hujianghua
--------------------------------------------------------------------------------------------------------
𝗖𝗵𝗮𝗿𝘁 𝗼𝗳 𝘁𝗵𝗲 𝗠𝗼𝗻𝘁𝗵: $TLT / $SPY Monthly. Key TestAll the way back down to blue TL. Could we see a reaction and get a #bond bounce?
$TNX $ZN_F $GLD $GC_F $GDX $DXY $SPY $SPX $ES_F $VIX $QQQ $NQ_F $DIA #Trading #Stocks #StockMarket 📈

