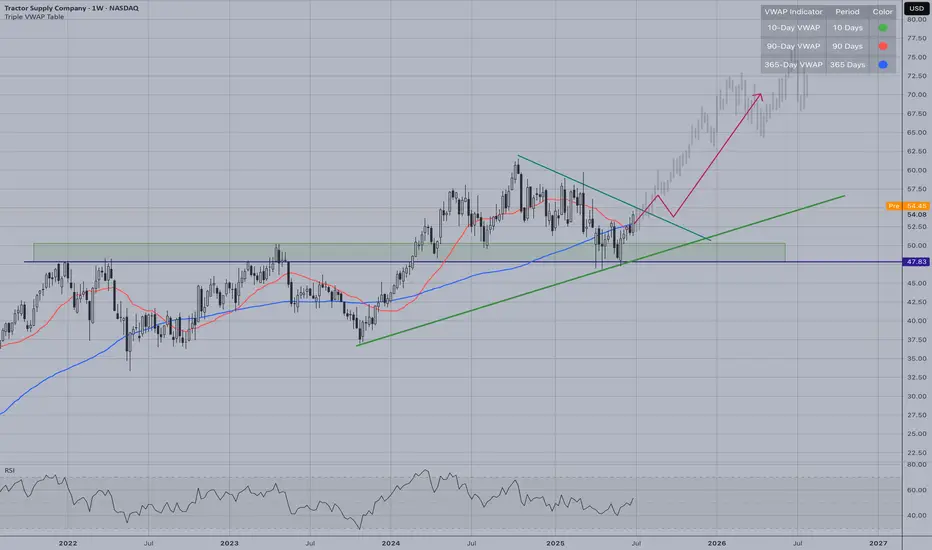
TSCO | Resistance Turned SupportTractor Supply Company (TSCO) demonstrates a textbook example of resistance-turned-support dynamics on the weekly chart. The stock has successfully broken above the previous resistance zone around $50-52 and is now using this level as strong support.
Key Technical Observations:
Clean breakout from multi-year consolidation pattern
Former resistance zone now acting as solid support
Strong upward momentum with price above all major moving averages
RSI showing healthy momentum without being overbought
Bullish Setup:
Entry: Current levels around $54 or on any pullback to the green support zone ($50-52)
Target: Initial resistance at $58-60 range, with longer-term potential toward $70+ following the projected path
Stop Loss: Below $49 (invalidation of support flip)
TSCO1 trade ideas
Nothing to love about this chart - but I'm a quant trader...If you've been following me for any length of time, you know what a trader-crush I have on TSCO. The success I've had with it over time has been about as good as any stock I trade.
This is a sad chart, when you look at it. There's really nothing here that screams buy right now. But the chart doesn't tell the whole story. While I'm not using my typical algo for this trade, I still have data on my side, and for me, that is what matters.
This situation has occurred 210 times in the history of TSCO and has paid off every single time. The results are even better, historically, than with the algo I usually use. The average gain is 2.14% in an average of 6.2 days. That's .34% per day held, or 86% annualized, and nearly 8x the average daily return of the market. But that's not the best part. Almost 80% of trades closed in 1 week or less, 92% in 3 weeks or less, and over 50% closed in one day.
I entered long at today's closing price of 49.67. The entry situation doesn't usually stick around for multiple days, but should it do so, I'll add to the position. While in this case, I usually close the trade on the close of the first bar the trade becomes profitable, if the gain is less than 0.1%, I will extend the trade.
As always - this is intended as "edutainment" and my perspective on what I am or would be doing, not a recommendation for you to buy or sell. Act accordingly and invest at your own risk. DYOR and only make investments that make good financial sense for you in your current situation.

$TSCO TSCO's fundamentals remain robustTechnical Analysis:
Recent technical indicators for TSCO present a mixed outlook. The stock is trading below its 50-day and 200-day moving averages, which are $60.75 and $60.67 respectively, indicating potential downward momentum. The Relative Strength Index (RSI) is at 34.23, approaching the oversold threshold of 30, suggesting a possible reversal if the trend continues. Short-term trends appear bearish, while mid- to long-term trends are neutral.
Fundamental Analysis:
Despite recent technical challenges, TSCO's fundamentals remain robust. The company reported net sales of $3.77 billion in the fourth quarter, up from $3.66 billion the previous year, driven by new store openings and a 0.6% increase in comparable store sales. For 2025, TSCO projects earnings between $2.10 and $2.22 per share and anticipates a revenue increase of 5% to 7%. The company's long-term "Life Out Here 2030 strategy" includes a target of 3,200 stores, with plans to open approximately 90 new Tractor Supply stores and 10 Petsense by Tractor Supply stores in 2025.
Additionally, TSCO's focus on the rural lifestyle market provides a unique niche with less direct competition. The company's specialized product offerings and private label brands contribute to higher profit margins and customer loyalty.
Conclusion:
While technical indicators suggest caution in the short term, TSCO's strong fundamentals and strategic growth initiatives indicate a bullish outlook for long-term investors. The company's expansion plans and focus on niche markets position it well for sustained growth.

Taking ANOTHER ride on the Tractor at 53.61I just posted an idea about TSCO 4 days ago, and nothing has changed (except that I have 1 more profitable trade in it than I did 4 days ago), so forgive me for not going into micro detail about this one.
I also posted another Idea about NYSE:J a few minutes ago that shares many features with this idea. This stock is down almost 12% since mid-October. But in that time, there were 16 long signals (not including today's) and 15 of the 16 closed profitably, while the one still open is down a hefty 9% or so.
But even with that one big loss, when combined with the 15 winners, the average per trade return is .25%. Now that's not great, and it's downright TERRIBLE for TSCO, but making .26% basically 16 times while a stock is trending down is not a bad place to be. And that doesn't count the very real probability that the -9% trade will end up being a winner before it's all over. Every other trade EVER in TSCO has. Hopefully the one I entered today will join that illustrious list.
It's another example that with the right trading rules, money CAN routinely be made when stocks are in downtrends, and believe me when I tell you, that feeling might be better than the even bigger wins on the way up. Volatility is what washes most people out in trading, both monetarily and psychologically. To be able to trade GOOD stocks (that's important) during a downtrend without fear is a remarkable feeling. As one who lost a lot of money in my Early trading days when catching rides on downward slides, it's very liberating to not be worried any more.
The key is GET OUT. Make your money and walk away from the table before "they" take it back. My trade in TSCO 4 days ago only made a couple tenths of a percent. But I got out, and now 4 days later I'm buying TSCO back even cheaper than before AND I have that profit from the last trade in my pocket and not back in the hands of someone else, and I am not trying to claw back that loss.
It has revolutionized my trading and taken me to a different level of success. I believe that feature of how I trade is applicable to a lot of other methods of trading, especially when things get tough. I love to end these by saying "nobody ever went broke taking a profit" - but it's absolutely true. Not letting winners become losers is a real key to being consistently profitable as a trader. I think we might be in for a lot of downtrends in the not too distant future. Be ready for them. I am.
Per my usual strategy, I'll add to my position at the close on any day it still rates as a “buy” and I will use FPC (first profitable close) to exit any lot on the day it closes at any profit.
As always - this is intended as "edutainment" and my perspective on what I am or would be doing, not a recommendation for you to buy or sell. Act accordingly and invest at your own risk. DYOR and only make investments that make good financial sense for you in your current situation.

TSCO supplies LARGE gains for me - LONG at 54.29TSCO may not be an obvious choice for the kind of short term trading I do, but that doesn’t stop it from being literally one of the 5 best stocks (historically) for my trading system. In backtests and live trades, it has a record of 892-1. The average gain on those trades was +2.6% in an average of 11 trading days for an average daily return of almost 6x that of the S&P. Both of those are very good numbers compared to the universe of over 2000 stocks I screen. Additionally, it produces low drawdowns with my system (all time max of 7.7%) and its max allocation of capital was 10 lots, less than half of the average stock in my universe. Basically, it produces outsized daily returns, with much smaller than average capital usage and small drawdowns. That's EXACTLY what this system is aiming for.
It would not surprise me, though, if it had a couple more down days first. When stocks gap down on earnings, that's usually not a 1 day thing. But while the setup here is not ideal, I'll take that chance, considering its outlandishly good returns over time. Like in poker or blackjack, there's always a chance for a bad beat, but the odds are decidedly in my favor here.
It has also had some semi-unpleasantly long trades of late, but even if this trade produces half the normal return AND takes twice as long to pay off, it's still a far better return than the average return of the market. There is plenty of near term support from the regression channel bottom as well as recent lows at 55.10 and 51.93 too. Here's hoping TSCO pulls some profits my way and does so quickly.
Per my usual strategy, I'll add to my position at the close on any day it still rates as a “buy” and I will use FPC (first profitable close) to exit any lot on the day it closes at any profit.
As always - this is intended as "edutainment" and my perspective on what I am or would be doing, not a recommendation for you to buy or sell. Act accordingly and invest at your own risk. DYOR and only make investments that make good financial sense for you in your current situation.

TSCO: Potential BuyPersonally missed the entry from yesterday at 210 USD. Expecting the price to climb towards 229 USD.

STDEV retracements with enhancementsIm looking for mean reversion opportunities in this stock currently. My SL is bassed on time to profit ratio. i dont use stop losses but will get out if theres a 50% decline. I tested for probalistic monthly sharpe ratio outperformance of the s and p 500.
I tested for monthly normality with the kolmogrov smirnov statistic. and looked for a non-significant p-value in order to signify the distibution fitting
I measured the annual sharpe ratio outperformance. I also measured the uler,calmar,sterling and martin ratio to compare ma drawdown, avg drawdown and loss after previous loss using the ulcer index.
I used the hurst exponent to measure if the return distributions are indeed mean reverting then lastly i created a portfolio based around a basket of qualified stocks and maximized its sharpe ratio.

TSCO - Don't back up the trailer just yet...Quarterly candle was a bearish engulfing, suggesting lower prices for this quarter. Other indicators also suggest one more push down is needed to complete this wave 4 correction/flat. Although the recent moves off the lows can be seen as motive, there is not a clean impulsive structure that really fits what the candles are saying on larger time frames. Last week was a bearish engulfing candle and something tells me this week will morph into a doji that will create a bearish harami combo, adding more fuel to this thesis. GLTA!

$TSCO - Green Line Break to ATHBreakout to ATH. Technical analysis suggests a move to $300 (Profit zone 1) and FWB:340 (Profit zone2) is likely over the next couple of years.

$TSCO - Tractor Supply ToppingTractor Supply... Love this store / company, although I have been out of the cattle business entirely (formally) for about a year now.
Anyway, TSCO looks like top.. So, with a basket full of chicken and a big cold jug of sweet tea, we will treat it like a top.

Head and ShouldersATH 241.54.
Looks like a H&S that is still above the neckline of 206.84. This pattern is not valid until the neckline is broken with a downtrend.
Price is still above the .236 of the trend up.
Several rising wedges well below price that are not valid as the bottom trendline is intact.
Price is above a prior rectangle and the top trendline is now support. The top line of the rectangle is also the neckline of the H&S pattern.
Targets in orange below the rectangle are break down targets from the rectangle.
No recommendation.
Earnings 1-26
EPS (FWD)
9.62
PE (FWD)
23.02
Div Rate (FWD)
$3.68
Yield (FWD)
1.66%
Short Interest
3.96%
Market Cap
$24.47B

$TSCO with a Neutral outlook following its earnings #Stocks The PEAD projected a Bullish outlook for $TSCO after a Positive over reaction following its earnings release placing the stock in drift B with an expected accuracy of 80%.

RectanglePossible resistance trendline in the way but it only has 2 touches.
The more a trendline is touched, the stronger it becomes.
Tall rectangle binding price action.
Earnings are 10-20 BMO
Neutral pattern until broken.
No recommendation.
Technical Analysis: Four Basic Principles
Markets alternate between range expansion and range contraction. ...
Trend continuation is more likely than reversal. ...
Trends end in one of two ways: climax or rollover.
Momentum precedes price.

$TSCO with a Bearish outlook following its earnings #Stocks The PEAD projected a Bearish outlook for $TSCO after a Negative Under reaction following its earnings release placing the stock in drift D with an expected accuracy of 80%.

TSCO - Broadening Formation CompletionTSCO is currently testing the upper line of this larger broadening wedge formation
This is looking to act as a point of resistance, supported by a bearish double top formation

TSCO - poised for breakup?After bouncing off it's low on 24 Feb, the stock has been consolidating sideways between 238 to 239 for the past 1 month. There was one attempt to breakup on 31 Mar which did not follow through. However it looks like it could attempt another breakup soon.
Long if it breaks above 239 again with tight initial stop loss slightly below last Friday's candle low at 230.
Disclaimer: Just my 2 cents and not a trade advice. Kindly do your own due diligence and trade according to your own risk tolerance and don't forget that money management is important!

TSCO Short Setup With Good Risk/RewardAfter making a lower low on the weekly, this is the logical place to short. Risk Reward to first PT is good.


TSCO broke out with volume!!* Strong earnings quarter over quarter
* Strong up trend
* Pays out dividends with a Payout ratio of 24.30% which means the company has a lot more room for growth
* Broke of a 4 month consolidation out with higher than average volume (19.09%)
* Making a new all-time-high
* Probable ROI of 17.19% if the trade plays out in our favor
Trade idea:
* $200.75 is expected to hold as support due to high volume breakout
* This may come back to retest $200.75 area so if you're looking for a discount that may be a great entry point
* Or you can buy in now and ride the trend if you can stomach a slight move down
A probable ROI of 17.19% would place the target at 240.03 area
Note:
* This is also a great long term hold as it pays out dividends


This Signal Has Tractor Supply Rising SoonBased on historical movement, the trough could occur anywhere in the larger red box. The final targets are in the green boxes. The pending top should occur within the larger green box as has been the historical case. Half of all movement has ended in the smaller green box. In this instance, the signal indicated BUY on July 23, 2021 with a closing price of 187.7.
If this instance is successful, that means the stock should rise to at least 189.79 which is the bottom of the larger green box. Three-quarters of all successful signals have the stock rise 8.587% from the signal closing price. This percentage is the bottom of the smaller green box. Half of all successful signals have the stock rise 17.077% which is the end point of the black dotted arrow. One-quarter of all successful signals have the stock rise 18.821% from the signal closing price which is the top of the smaller green box. The maximum rise on record would see a move to the top of the larger green box. These are the same concepts for the levels in the red boxes as well.
The ends/vertical sides of the boxes are determined in a similar fashion. The peak of the rise can occur as soon as the next trading bar after signal close, while the max rise occurs within the limit of study at 35 trading bars after the signal. A 1% rise must occur over the next 35 trading bars in order to be considered a success. Three-quarters of successful movement occur after at least 15 trading bars; half occur within 27 trading bars, and one-quarter require at least 32 trading bars.
The black dotted arrow represents median historical movement. Medians are a good metric, but they are just one of many I use when forecasting future movement.
As always, the stock could decline the very next bar after the signal without looking back (therefore the red boxes would not come into play) or the stock may never decline (and the green boxes may never come into play).

ABC Bullishpossible stop under C or last pivot low
Pocket pivot (green triangle) not far under price.
ABC is corrective pattern, there is a bullish and a bearish version. The bullish pattern will start with a leg up (AB)and then has a pull back on the 2nd leg (BC). Wait for confirmation that C is actually C as if it passes u C by too much, you can be looking at a double bottom, triple bottom, inverses H&S or even a harmonic pattern.
Often the next, and last leg up, the CD leg, will be .38, .62 or .79 of the ab LEG. This can extend further to the 1.272 or 1.618 fib levels depending on the momentum of the security. If CD is 100 percent of AB, you may have an AB=CD pattern.
For an AB=CD or an ABC pattern you can use your magnet and move the AB leg placing it on top of C to get an idea where is may go.
Looks like earnings are over?
No recommendation.
