Uranium bullish gartley , new uranium ETF HURA laucnhed as well,uranium divergence formi AMEX:URA ng on Uranium participation corp
URA trade ideas


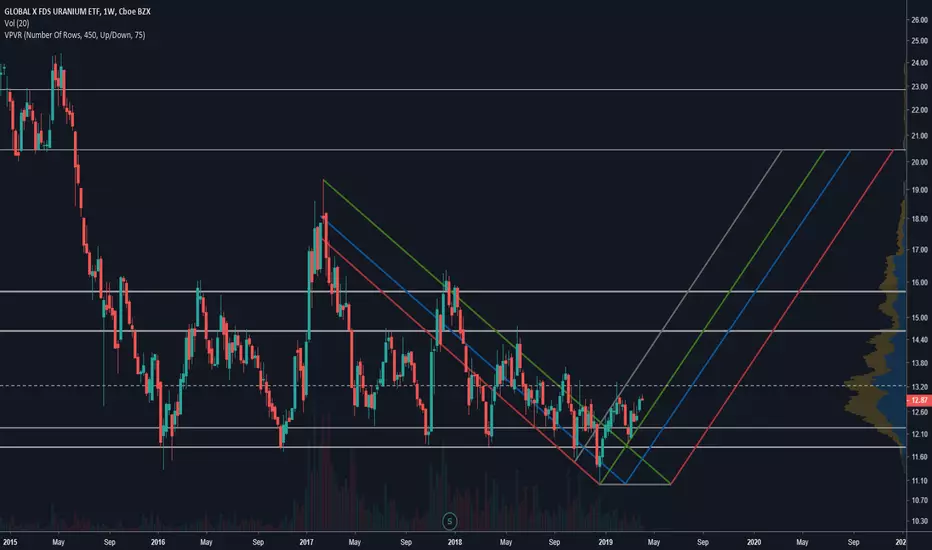
ura in wedge on long term support. possible break to the upside?Been watching ura.
if follows pattern may be good little trade developing here..

URA update 10apr2019 @cryptoKneeYawn...slowly grinding up, getting some div on 4H and below pos retrace coming soon, schiff PF median line playing as resist, regular PF outer fork will be hit tomorrow, more PA up will come to the Channel median line...Yawn..

Oorah URA v2Looking like a great time to buy URA . Otherwise, it'll be a safe place to hide your mulah.
If you're into Wyckoff, it actually looks like a nice spring.

Oorah URALooking like a great time to buy URA. Otherwise, it'll be a safe place to hide your mulah.
If you're into Wyckoff, it actually looks like a nice spring.
$URA Will be interesting to see what happens here, nice hammer.If this jumps from a somewhat lower position it could end up being a inverted H&S, even without that still a good doji hammer.

Looking to long URA if it breaks out above $13Been watching URA for a while now. If it breaks out above $13, I can see it going to $14-$16 short term. Being patient until then.

URA: Incredible Weekly Set UpGood morning. With the cryptocurrency and weed markets still in consolidation, I've been sitting on cash waiting for a good long term set up. Uranium is probably the most hated market of all right now. It's seen nothing but downside for the past 11 years, but is beginning to show hope with this setup.
While AMEX:URA isn't a perfect tracker of the Uranium futures market, it is one of the better ways to capitalize on the commodity as Uranium sets up bullish on the weekly chart as well.
Oversold RSI
What I've noticed is that a low was established in 2016 along with an oversold condition in the RSI and has been respected when recently tested on a false break out to the downside. This creates a good case for a long term bottom in the market and potential for the start of a Uranium bull market.
Descending Triangle
Price has been squeezing down since Feb of 2017. That's 2 years of coiling price waiting for a breakout. What we saw in December was a bearish breakout to the downside rejected when faced with it's all time low. This is a good sign.
Price has now reversed and broken to the upside of the triangle pattern. This is also a good sign.
Increased Volume
Along with a bottoming formation, an Oversold RSI, and a Descending Triangle Breakout, volume has increased dramatically for AMEX:URA . This is a sign that there may be some interest entering the Uranium market after a long 11 years.
Challenges
While these are bullish signs for AMEX:URA , there are still some risks that Uranium could linger at the bottom for a number of years:
Lack of Interest in Uranium
100 and 200 Weekly MA Resistance
It is possible this breakout is shut down by the 100 and 200 MA, and we linger at the bottom for a number of years. Even so, this is a great time for me to accumulate for the longer term.
Thanks for stopping by!
Find Me on the Internet
AssetGuild.com
Twitter
Instagram
YouTube
StockTwits Room
Discord
Telegram @micahmiller
Nothing in this post shall be taken as person financial advice. This is personal opinion and educational content only.

Uranium Simple chart
broke down trend, consolidation now seems to be breaking up. all that volume looks nice. keep in mind this is a weekly chart

$URAURA Possible R/S Flip. If this holds will add to my position Monday. Lots of catalysts for Uranium equities.


Uranium Flirting with BreakoutVery notable test of year long trend line, waiting for daily close above and possible retest before entry.
Anyone with experience investing in this sector feel free to hit me up, thanks.


Uranium expecing rallyTrading at the bottom should be a rally up to 15-20$ in the near months
see my analysis

URA ready to go higherI was hodling URAnium for a long and now we are looking for a nice entry, we had a nice looking 9 on TD sequential along with fib retracement, now we are with 2% handicap already for the daily entrance but I guess it is still ok given R:R ratio

More Down Before Next Uptrend-RSI looking weak telling us this sell off is not over
-MACD about to cross below MACD signal line signaling a continuation of downtrend as we stay below 50 Day Moving Average
Safe Buy Zone at long term support 11.60-11.75
This is my first published idea :) If you have any criticism or other ideas please share in comments

$URA - #Uranium Lift-Off?Spot Uranium's been on a tear...MAYBE it's time for URA to final get off the floor?

BUY URA on Desc TriLSE:URA Excellent squeeze of a Descending Tri made from multiple upper and lower points. Bullish Triple Tower
