Visa's (V:NYSE) Financial Results: An Informative OverviewVisa's Upcoming Financial Results: An Informative Overview
Introduction
Today July 25th, Visa, a renowned financial services company, is scheduled to release its latest financial results. This event has garnered significant attention from investors and analysts alike, as it provides valuable insights into the company's performance and prospects. In this overview, we will examine the factors that suggest Visa is currently fairly valued compared to historical metrics and its peer group, as well as the implications of a Discounted Cash Flow Analysis. Additionally, we will explore the potential opportunities that may arise from a possible decline in Visa's stock price following the earnings announcement.
Valuation Assessment
Visa's current valuation is a subject of interest for investors who seek to gauge the attractiveness of the company's stock. By analyzing historical metrics, market peers, and financial models, experts have gained valuable insights into the company's valuation.
1. Historical Metrics
Comparing Visa's current valuation metrics, such as price-to-earnings ratio (P/E), price-to-book ratio (P/B), and dividend yield, to its historical averages can provide useful context. If the current metrics align closely with historical averages, it may indicate that the stock is reasonably priced.
2. Peer Comparison
Benchmarking Visa's valuation against its industry peers is another crucial aspect of the analysis. By comparing valuation ratios, growth prospects, and market share,investors can gain a sense of how Visa stacks up against its competitors.
3. Discounted Cash Flow (DCF) Analysis
A Discounted Cash Flow Analysis is a widely used financial model that estimates the intrinsic value of a company based on its future cash flows. This approach considers factors such as projected revenue, expenses, and capital expenditures, and discounts them to their present value. A DCF analysis can help determine whether Visa's current stock price accurately reflects its expected future cash flows.
Potential Entry Point Opportunity
The release of Visa's financial results might trigger a market reaction, leading to fluctuations in the stock price. Investors often view these price movements as potential entry points for investment.
1. Attractive Entry Point
Should Visa's stock price experience a decline following the earnings announcement, some investors may perceive this as an attractive entry point. If the fundamental strength of the company remains intact, the temporary decline in stock price could be an opportunity to acquire shares at a potentially discounted price.
2. Risk Consideration
While there may be an opportunity for entry, it is crucial for investors to carefully assess the risks inherent in the stock market. In addition to company specific developments, they must consider macro indicators including prevailing economic conditions, market volatility and industry changes.
Conclusion
Visa's upcoming financial results release on July 25 holds considerable importance for investors seeking to understand the company's current performance and valuation. By examining historical metrics, conducting a peer comparison, and considering a Discounted Cash Flow Analysis, experts have determined that Visa appears fairly valued at present. Moreover, a potential decline in stock price after the earnings announcement may present an appealing entry point for investors who believe in the long-term prospects of the company. Nevertheless, investors should exercise caution and conduct thorough research before making any investment decisions, taking into account the inherent risks in the stock market.
This content is provided for general information purposes only and is not to be taken as investment advice nor as a recommendation for any security, investment strategy or investment account.
V trade ideas

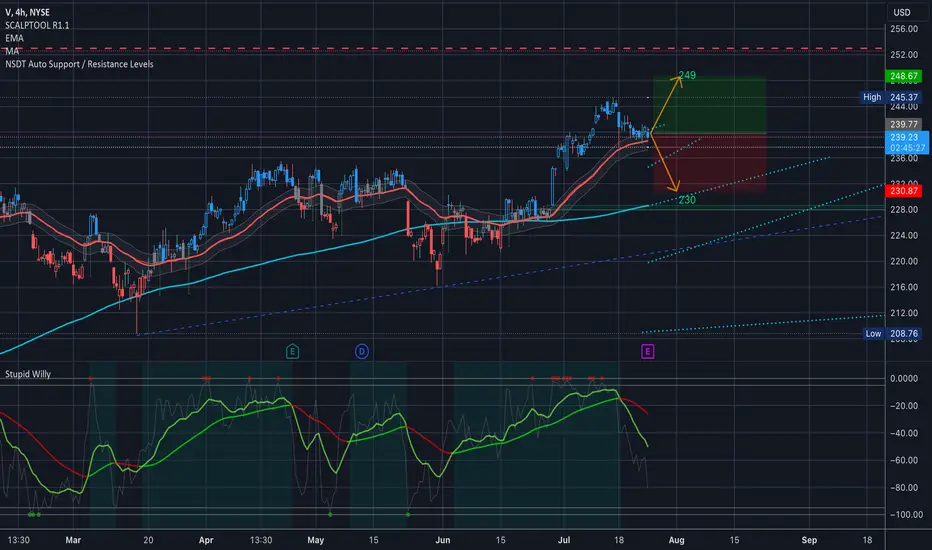
$V EARNINGS Analysis, Key Levels & TargetsNYSE:V EARNINGS Analysis, Key Levels & Targets
Implied move for earnings today is between 230 - 249 (3.71% move)
I do not have a position here but looking to the downside from here…. Alerts set at 230 & 222
Pairs Trading Strategy. Two instruments in one chart
We seek the development of a strategic chart indicator capable of visually concealing differentials between two financial instruments on a singular chart. Presently, we utilize a conventional approach whereby one instrument is opened and juxtaposed with another, resulting in the observation of two distinct lines. To enhance the efficacy of pairs trading, a hedge strategy entailing the purchase of one instrument and simultaneous sale of another correlated instrument, we endeavor to implement a more precise method wherein both instruments' disparities are represented as a singular line, candle chart, or similar graphical representation.

Diving into Visa, a potential double on the horizon!Equity Trade Idea of the Week: V
It’s not every day that a world-class company trades at an attractive price.
Here’s how I see the company’s valuation…
Visa is currently trading slightly above its technical BUY ZONE, at a multiple of approximately 29 earnings per share of $7.80.
Over the past five years, Visa has been able to grow earnings by 15% per year.
Based on the research, and factoring in a margin of safety, Visa should be able to grow earnings per share by 11% annually over the next six years.
Based on that growth rate, earnings per share would be around $14.50 in 2029.
Applying at a 30X multiple and adding in dividends, the share price should be around $450, or roughly a 100% return.
Actions to Consider: Buy Visa Inc. (NYSE: V), book partial profits at Target #1 ($261.00), move Stop Loss to your Entry, book additional profits at Target #2 ($283.00) and then leave the balance of your position to run towards the projected $450.00 end goal target.

RectangleThe height of this structure is small.
Rectangle targets can be guesstimated by projecting the height of the structure it up from the Resistance line or down from the support line.
T1 partially met.
No recommendation.

VISA one last push for a Higher High, correction after.It has been almost 8 months since we called for a heavy buy on Visa Inc (V) following the long term Channel Down upward break-out (see chart below), an analysis that attracted such interest that was featured on TradingView's Editors' picks:
As you can see, that projection is so far flawless and Visa is cruising into a new Bull Cycle.
At the moment, the price is pushing for the new Higher High of the long-term Channel Up that it's been trading in since the December 22 2022 Low. Based on the 1D RSI, we are in a similar position like January 20 and April 11, where both sequences pushed for the Higher High on the 2.0 Fibonacci extension level, before correcting aggressively below the 1D MA20 (blue trend-line) and the -1.0 Fibonacci extension level.
As a result, we are going long but only short-term, targeting the 2.0 Fib at 244.00 and then sell for the medium-term, aiming at a little lower than the -1.0 Fib at 231.00.
-------------------------------------------------------------------------------
** Please LIKE 👍, FOLLOW ✅, SHARE 🙌 and COMMENT ✍ if you enjoy this idea! Also share your ideas and charts in the comments section below! **
-------------------------------------------------------------------------------
💸💸💸💸💸💸
👇 👇 👇 👇 👇 👇

Longing Visa today. VAB=CD pattern at the of this constellation. We have cracked the top side of ABCD triangle on a climbing momentum. Hugging the top 2s.f. line of the Bollinger bands on a slightly trending Bollinger MA. Chaikin does show dropping vol, but I believe this to be part in parcel of general Wave B behaviour. Could be developing an inverted head and shoulder pattern in B wave position, yet that scenario is still bullish, unlikely to cross stop loss.
Fibonacci with Kennedy channeling gives some targets to ponder.
We are not in the business of getting every prediction right, no one ever does and that is not the aim of the game. The Fibonacci targets are highlighted in green with invalidation in red. Confirmation level, where relevant, is a pink dotted, finite line. Fibonacci goals, it is prudent to suggest, are nothing more than mere fractally evident and therefore statistically likely levels that the market will go to. Having said that, the market will always do what it wants and always has a mind of its own. Therefore, none of this is financial advice, so do your own research and rely only on your own analysis. Trading is a true one man sport. Good luck out there and stay safe.

Will Visa takes on a larger market share in China ?www.shine.cn
Now with the Covid-19 becoming a history of the past and China aggressively opening up to the world, the tourism market will accelerate the usage of credit cards by overseas travelers in China. This bodes well for credit card company like Visa.
I believe moving forward, we can expect the chart to show a breakout of the resistance at 234 level and continue to rally higher towards 250 and beyond.
Please DYODD

Trading is SimpleSelect number of stocks based on your own fundamental criterias. After that you just need to identify the sentiment/trend of each stocks. The most basic and easy way to identify it is the 20ema/50ema situation in the Daily TF (you can zoom in or zoom out to different TF. Up to you).
When 20ema is above 50ema, then move to a smaller TF to time your entry, to find optimal entry point.


Visa May Be Attempting a BreakoutVisa has barely moved since February, but traders could look for that to change as a new quarter approaches.
The first pattern on today’s chart is the series of higher monthly lows since December.
Those have been followed by higher daily lows since May 31. Prices were trapped below a high from April 2022 until jumping yesterday. That broke the top of an ascending triangle, a potentially bullish continuation pattern.
V additionally pushed through its 50-day simple moving average (SMA).
Speaking of moving averages, the 8-day exponential moving average (EMA) recently crossed above the 21-day EMA. Combined with the rising MACD, that could indicate the shorter-term trend has grown more bullish.
Finally, the lower study shows narrowing Bollinger Band Width as V paused in the first half of 2023. Does that open the door to price expansion in the second half?
TradeStation has, for decades, advanced the trading industry, providing access to stocks, options, futures and cryptocurrencies. See our Overview for more.
Important Information
TradeStation Securities, Inc., TradeStation Crypto, Inc., and TradeStation Technologies, Inc. are each wholly owned subsidiaries of TradeStation Group, Inc., all operating, and providing products and services, under the TradeStation brand and trademark. TradeStation Crypto, Inc. offers to self-directed investors and traders cryptocurrency brokerage services. It is neither licensed with the SEC or the CFTC nor is it a Member of NFA. When applying for, or purchasing, accounts, subscriptions, products, and services, it is important that you know which company you will be dealing with. Please click here for further important information explaining what this means.
This content is for informational and educational purposes only. This is not a recommendation regarding any investment or investment strategy. Any opinions expressed herein are those of the author and do not represent the views or opinions of TradeStation or any of its affiliates.
Investing involves risks. Past performance, whether actual or indicated by historical tests of strategies, is no guarantee of future performance or success. There is a possibility that you may sustain a loss equal to or greater than your entire investment regardless of which asset class you trade (equities, options, futures, or digital assets); therefore, you should not invest or risk money that you cannot afford to lose. Before trading any asset class, first read the relevant risk disclosure statements on the Important Documents page, found here: www.tradestation.com .

V - Rising Trend Channel [MID -TERM]🔹Strong development within a rising trend channel in the medium long term.
🔹Moving within a Rectangle Formation between support 223 and resistance 237.
🔹POSITIVE signal Rectangle Formation with breakout resistance 211.
🔹Support is 216 if negative reaction occurs and next resistance at 266.
🔹Technically POSITIVE for the medium long term.
Chart Pattern;
🔹DT - Double Top | BEARISH | 🔴
🔹DB - Double Bottom | BULLISH | 🟢
🔹HNS - Head & Shoulder | BEARISH | 🔴
🔹REC - Rectangle | 🔵
🔹iHNS - inverse head & Shoulder | BULLISH | 🟢
Verify it first and believe later.
WavePoint ❤️

Visa ($V) LongVisa Long on a huge bullish flag/pennant formation. Looking for a breakout or sideways action with 225 major support for next few weeks.

V: Sell ideaSell idea on V as you see on the chart because we have the breakout with force the vwap and the support line.Thanks!!!

Visa to break higher?Visa - 30d expiry - We look to Buy a break of 236.11 (stop at 230.38)
The primary trend remains bullish.
This is currently an actively traded stock.
Trading volume is increasing.
235.57 has been pivotal.
A break of the recent high at 235.57 should result in a further move higher.
There is no clear indication that the upward move is coming to an end.
Our profit targets will be 249.78 and 252.78
Resistance: 230.00 / 235.57 / 240.00
Support: 223.00 / 220.00 / 216.14
Please be advised that the information presented on TradingView is provided to Vantage (‘Vantage Global Limited’, ‘we’) by a third-party provider (‘Signal Centre’). Please be reminded that you are solely responsible for the trading decisions on your account. There is a very high degree of risk involved in trading. Any information and/or content is intended entirely for research, educational and informational purposes only and does not constitute investment or consultation advice or investment strategy. The information is not tailored to the investment needs of any specific person and therefore does not involve a consideration of any of the investment objectives, financial situation or needs of any viewer that may receive it. Kindly also note that past performance is not a reliable indicator of future results. Actual results may differ materially from those anticipated in forward-looking or past performance statements. We assume no liability as to the accuracy or completeness of any of the information and/or content provided herein and the Company cannot be held responsible for any omission, mistake nor for any loss or damage including without limitation to any loss of profit which may arise from reliance on any information supplied by Signal Centre.

RectanglePrice is literally hanging on the support line.
Neutral pattern until broken and also known as a Horizontal Channel.
No recommendation.
52 Week Range
174.60
238.05
Day Range
216.14
220.36
EPS (FWD)
8.59
PE (FWD)
25.81
Div Rate (FWD)
$1.80
Yield (FWD)
0.81%
Short Interest
2.06%
Market Cap
$454.17B

$V - VISA Wyckoff Distribution Visa showing signs of weakness... Here is what we're seeing with Wyckoff Distribution

Visa Possible Long BreakoutNYSE:V might see a breakout to the $244.86 price level if it breaks out from the $235 price range. If it hits $236.50, then that may be a good entry into this small bullish run.


Visa Bullish PatternNYSE:V has tested the bottom support trend line multiple time now, and has shown that it's strong. When NYSE:V breaks out of the $235 range, then it may head towards the $244.86 price target.

Visa to break higher?Visa - 30d expiry
The primary trend remains bullish.
This is curremtly an actively traded stock.
Trading volume is increasing.
235.57 has been pivotal.
A break of the recent high at 235.57 should result in a further move higher.
There is no clear indication that the upward move is coming to an end.
We look to Buy a break of 236.11 (stop at 231.38)
Our profit targets will be 249.78 and 252.78
Resistance: 235.57 / 240 / 250
Support: 228 / 223.50 / 220
Please be advised that the information presented on TradingView is provided to Vantage (‘Vantage Global Limited’, ‘we’) by a third-party provider (‘Signal Centre’). Please be reminded that you are solely responsible for the trading decisions on your account. There is a very high degree of risk involved in trading. Any information and/or content is intended entirely for research, educational and informational purposes only and does not constitute investment or consultation advice or investment strategy. The information is not tailored to the investment needs of any specific person and therefore does not involve a consideration of any of the investment objectives, financial situation or needs of any viewer that may receive it. Kindly also note that past performance is not a reliable indicator of future results. Actual results may differ materially from those anticipated in forward-looking or past performance statements. We assume no liability as to the accuracy or completeness of any of the information and/or content provided herein and the Company cannot be held responsible for any omission, mistake nor for any loss or damage including without limitation to any loss of profit which may arise from reliance on any information supplied by Signal Centre.

$V - Double top or break out?NYSE:V #Visa After retesting the multi-year trend line Visa broke out of the descending wedge. Currently at resistance. Could head to $251. Downside risk is $211.
👀

V - Visa, credit card use is on a highAccording to a recent survey by Bankrate, 49% of U.S. adults have less or no savings compared to a year ago. This means that nearly half of Americans are living paycheck to paycheck and are not prepared for an unexpected expense.
The bankruptcy rate in the United States has been declining for the past 10 years. In 2015, there were 741,000 bankruptcy filings, but by 2022, that number had fallen to 326,000. This decline is due to a number of factors, including:
The availability of credit counseling and debt management plans
The changes to the bankruptcy laws in 2005
While the bankruptcy rate is declining, it is still a significant problem for many Americans. In 2022, the average bankruptcy filing had $107,000 in debt, and the majority of those debts were credit card debt.
We have market influencers suggesting the credit card use is on the extreme rise.
Considering the data provided, why is Visa stock not reflecting a bullish trend?
Considering the data points provided, are these market influencers wrong and are promoting FUD?
Is the agenda to emotionally crash the market for the sake of sending stock prices lower placing stocks at a highly discounted rate?
Saving the hedge fund shorts of certain overly leveraged stocks with very high loan to borrow interest rates?
Who are these market players that have the ability to bring down the market? Citadel?
Year | Total credit card debt (billions of dollars)
-------|----------------------------
2015 | 938.3
2016 | 982.6
2017 | 1,018.8
2018 | 1,057.3
2019 | 1,090.0
2020 | 1,107.8
2021 | 1,134.3
2022 | 1,160.0
Year | Bankruptcy filings (thousands)
-------|----------------------------
2015 | 741
2016 | 691
2017 | 641
2018 | 591
2019 | 541
2020 | 391
2021 | 351
2022 | 326
Sure, here is a chart showing credit card use in the United States from 2015 to 2022:
Year | Total credit card debt (billions of dollars)
-------|----------------------------
2015 | 938.3
2016 | 982.6
2017 | 1,018.8
2018 | 1,057.3
2019 | 1,090.0
2020 | 1,107.8
2021 | 1,134.3
2022 | 1,160.0
As you can see, credit card debt has been steadily increasing in the United States since 2015. In 2022, total credit card debt reached an all-time high of $1.16 trillion.
There are a number of factors that have contributed to the increase in credit card debt, including:
The rising cost of living
The decline of consumer savings
The ease with which people can get credit cards
The marketing of credit cards to consumers
According to a recent survey by Bankrate, 49% of U.S. adults have less or no savings compared to a year ago. This means that nearly half of Americans are living paycheck to paycheck and are not prepared for an unexpected expense.
There are a number of reasons why Americans are struggling to save money. The cost of living is rising, wages are stagnant, and many people are carrying debt from student loans, credit cards, and other sources.
The bankruptcy rate in the United States has been declining for the past 10 years. In 2015, there were 741,000 bankruptcy filings, but by 2022, that number had fallen to 326,000. This decline is due to a number of factors, including:
The improving economy
The availability of credit counseling and debt management plans
The changes to the bankruptcy laws in 2005
While the bankruptcy rate is declining, it is still a significant problem for many Americans. In 2022, the average bankruptcy filing had $107,000 in debt, and the majority of those debts were credit card debt.
Here is a chart showing the bankruptcy rate in the United States from 2015 to 2022:
Year | Bankruptcy filings (thousands)
-------|----------------------------
2015 | 741
2016 | 691
2017 | 641
2018 | 591
2019 | 541
2020 | 391
2021 | 351
2022 | 326
There are many different market makers in the United States. Some of the largest and most well-known market makers include:
Citadel Securities
Virtu Financial
Two Sigma Securities
Jane Street Capital
IMC Financial Markets
G1 Executions Services
Flow Traders
Susquehanna International Group
Optiver
Wellington Shields
These market makers are responsible for providing liquidity to the markets by buying and selling securities on a continuous basis. They make money by taking a small profit on the difference between the bid and ask prices.
