Key stats
About VANGUARD FINANCIALS ETF
Home page
Inception date
Jan 26, 2004
Structure
Open-Ended Fund
Replication method
Physical
Dividend treatment
Distributes
Distribution tax treatment
Qualified dividends
Income tax type
Capital Gains
Max ST capital gains rate
39.60%
Max LT capital gains rate
20.00%
Primary advisor
The Vanguard Group, Inc.
Distributor
Vanguard Marketing Corp.
The fund is passively managed to hold US financials stocks across all market caps. The fund uses a market-cap selection and weighting scheme with a portfolio that captures the broader financials market. In September 2016, the fund sold off all its REITs (except for mortgage REITs), a substantial part of the portfolio. It did so to comply with a change in GICS methodology, the sector framework supporting its underlying index. It increased its allocation to remaining financial industries in accordance with the revamped underlying index. To ensure diversification, the index applies investment limits on regulated investment companies of no more than 25% of value to a single issuer, and the sum of the weights of all issuers with more than 5% not exceeding 50% of total assets. The index is rebalanced on a quarterly basis.
Classification
What's in the fund
Exposure type
Finance
Stock breakdown by region
Top 10 holdings
Summarizing what the indicators are suggesting.
Oscillators
Neutral
SellBuy
Strong sellStrong buy
Strong sellSellNeutralBuyStrong buy
Oscillators
Neutral
SellBuy
Strong sellStrong buy
Strong sellSellNeutralBuyStrong buy
Summary
Neutral
SellBuy
Strong sellStrong buy
Strong sellSellNeutralBuyStrong buy
Summary
Neutral
SellBuy
Strong sellStrong buy
Strong sellSellNeutralBuyStrong buy
Summary
Neutral
SellBuy
Strong sellStrong buy
Strong sellSellNeutralBuyStrong buy
Moving Averages
Neutral
SellBuy
Strong sellStrong buy
Strong sellSellNeutralBuyStrong buy
Moving Averages
Neutral
SellBuy
Strong sellStrong buy
Strong sellSellNeutralBuyStrong buy
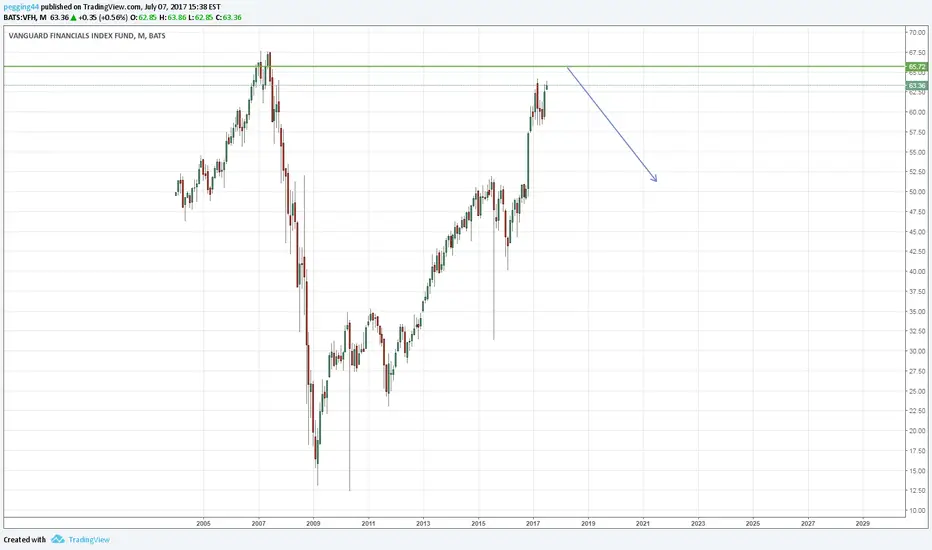
Displays a symbol's price movements over previous years to identify recurring trends.
Related funds
Frequently Asked Questions
An exchange-traded fund (ETF) is a collection of assets (stocks, bonds, commodities, etc.) that track an underlying index and can be bought on an exchange like individual stocks.
VFH trades at 2,424.70 MXN today, its price has risen 4.15% in the past 24 hours. Track more dynamics on VFH price chart.
VFH net asset value is 2,336.38 today — it's risen 9.51% over the past month. NAV represents the total value of the fund's assets less liabilities and serves as a gauge of the fund's performance.
VFH assets under management is 230.61 B MXN. AUM is an important metric as it reflects the fund's size and can serve as a gauge of how successful the fund is in attracting investors, which, in its turn, can influence decision-making.
VFH price has risen by 5.95% over the last month, and its yearly performance shows a 44.12% increase. See more dynamics on VFH price chart.
NAV returns, another gauge of an ETF dynamics, have risen by 9.51% over the last month, showed a −5.02% decrease in three-month performance and has increased by 44.77% in a year.
NAV returns, another gauge of an ETF dynamics, have risen by 9.51% over the last month, showed a −5.02% decrease in three-month performance and has increased by 44.77% in a year.
Since ETFs work like an individual stock, they can be bought and sold on exchanges (e.g. NASDAQ, NYSE, EURONEXT). As it happens with stocks, you need to select a brokerage to access trading. Explore our list of available brokers to find the one to help execute your strategies. Don't forget to do your research before getting to trading. Explore ETFs metrics in our ETF screener to find a reliable opportunity.
VFH invests in stocks. See more details in our Analysis section.
VFH expense ratio is 0.09%. It's an important metric for helping traders understand the fund's operating costs relative to assets and how expensive it would be to hold the fund.
No, VFH isn't leveraged, meaning it doesn't use borrowings or financial derivatives to magnify the performance of the underlying assets or index it follows.
In some ways, ETFs are safe investments, but in a broader sense, they're not safer than any other asset, so it's crucial to analyze a fund before investing. But if your research gives a vague answer, you can always refer to technical analysis.
Today, VFH technical analysis shows the buy rating and its 1-week rating is buy. Since market conditions are prone to changes, it's worth looking a bit further into the future — according to the 1-month rating VFH shows the strong buy signal. See more of VFH technicals for a more comprehensive analysis.
Today, VFH technical analysis shows the buy rating and its 1-week rating is buy. Since market conditions are prone to changes, it's worth looking a bit further into the future — according to the 1-month rating VFH shows the strong buy signal. See more of VFH technicals for a more comprehensive analysis.
Yes, VFH pays dividends to its holders with the dividend yield of 1.76%.
VFH trades at a premium (0.21%).
Premium/discount to NAV expresses the difference between the ETF’s price and its NAV value. A positive percentage indicates a premium, meaning the ETF trades at a higher price than the calculated NAV. Conversely, a negative percentage indicates a discount, suggesting the ETF trades at a lower price than NAV.
Premium/discount to NAV expresses the difference between the ETF’s price and its NAV value. A positive percentage indicates a premium, meaning the ETF trades at a higher price than the calculated NAV. Conversely, a negative percentage indicates a discount, suggesting the ETF trades at a lower price than NAV.
VFH shares are issued by The Vanguard Group, Inc.
VFH follows the MSCI US IMI 25/50 Financials. ETFs usually track some benchmark seeking to replicate its performance and guide asset selection and objectives.
The fund started trading on Jan 26, 2004.
The fund's management style is passive, meaning it's aiming to replicate the performance of the underlying index by holding assets in the same proportions as the index. The goal is to match the index's returns.