$XLC inverse head & shoulders AMEX:XLC inverse head & shoulders target is the horizontal line gap fill.
XLC trade ideas

XLC , Long Back in this , not too happy with risk/stop/reward setup , but this was planned to be focused on and until it does something wrong , I buy it . So here goes . I highlighted the nearby resistance which I think is significant and I could see it getting stuck there and visiting lower in the range . But I run on the principle that it's more important to just follow the signal and this is a signal .

XLC , Long Alright , take two la de doo . Nobody knows anything, just follow your darn system and if you don't have one well maybe go fishing :)
It ain't easy being green , que Kermit the frog~
My account went from +5% to -5% this last week btw . I can't be the only one , stay consistent, don't get lost in the woods .
And remember that " The Old horse sniffs the wind " , chinese Cheng Yu (saying) . Do you know why? I do , the old horse has risk management lol .
Have a super freaking awesome day.

XLC If you're unfamiliar with this sector , this the home sector of
1.Google
2.Meta
3.Nflx
4.Disney
As you can see this weekly chart is showing a big arse Inverted H&S. Your rarely see H&S so big that you can spot them on the weekly too.
This year the only other massive Inverted H&S I've seem is NVDA.
At first when I saw it, I was like GTFOH, no way Nvda back to 290. Alas we have arrived
Still this thing has to breakout first .
I'd say anything over 61 here is a breakout
With those tech names having earnings this season will see what happens in another 2weeks but as you can see what happen to meta and nflx when this sector went from 46 in December to 58 now. Where will those stocks go if XLC breaks out to 71?

XLC Can't catch a bid?Although XLC has been trending up since November, it has failed to increase its rate of change. It continues to find a ceiling at the .764 threshold...

XLC, LONGI decided to get long this at the close on Friday,
I might actually be jumping the gun a bit though , would be nice to see it take out the 60.24 level with a breakout above , however this looks like it has potential and based on my trades risk if it does work it will be a quick de risk .
This is a very very beat up ETF , the worst of the groups in my opinion , so if OCT 13th was indeed a bottom , it may stand to reason that this could be a good comeback play , trend permitting .
Also , I felt like the market was going to fail last week when I've been bullish since Oct 13 2022 , last week was the first time I lost that bull market feeling since Oct 13th, a little at-least . Then we had the two day rally for thurs and Friday . I really think that most of the time it is best to be contrarian , but I was a bear from monday to wed last week , even took a small SQQQ trade in the day trade account for fun . But when we start getting controlled by the market like that , especially when we are bullish bias , we need to recognize that the market just did to our emotions and probably do the opposite of what we are feeling .
Looking at the inner names making up this
The largest are META (20%), GOOGLE(21%) , VERIZION(8%), DISNEY ( 4.61%) and NETFLIX(4.39%) .
META is looking like it really wants to transition to a stage two , has a gap up suprise on daily and has taken out out some highs to the left , its arguably in an early stage 2 but would be nice to see it make another higher high and hold current levels , could be more of a stage one , but there is a lot of signs it might keep going for me
Google , is weak . looks more like a range at best at this time , needs more time to set up . It's still in a stage 4 i'd say but it did kind of break above its DTL the other day , so some early signs of downtrend losing strength, maybe...
Verizon , even weaker than goog , stage 4 still on .
Dis , broken out of its DTL , stage one seems reasonable ..
NFLX , Strongest of the bunch , Stage two on and strong , had a UCB ( upper channel breakout ) which proved bearish but still in a solid stage 2 .
So that's , 2 stage 4s , 1 stage two , 1 "almost" stage two and one stage 1 . Also the market wedge popped on friday so this trade may be early but all the signals lined up so lets see how it goes . I think that on some timeframes XLC is in a stage 2 but a better level to get active above is . Honestly , I think that there's nothing with waiting to start getting active above 60.30 level instead, which is a defined S2 , but I got a little excited on fridays close so I'm in already lol

XLC (Googl ,Meta, NFlx)XLC like XLK still looks bullish after 2 day pullback... Closed above 54 fib support.
Looking for a leg up to .236 in the coming sessions
Targets - Googl 97$
Meta - 200
Setup is negated below 54

XLC (Googl,META,Nflx)A big reason I never was a short ran on NFLX at 313 was because of its sector..
This bullish wedge breakout should take the above mentioned stocks higher with it

XLC - Meta, NFLX,GooglePulled back since my last post..
Forming a falling wedge here, Daily money flow indicating a nice pop incoming here.
Google is also forming a falling wedge and NFLX is outside its daily Bollinger bands. I think this sector and the stocks included push the nasdaq higher this week.
Closed directly under its 200sma ,
Strong Support is at 52.30 - Fib + 50sma

XLC (Googl,META,NFLX)If you've been wondering why these stocks have traded in range this week now you can see why.
XLC has been range trading in the white channel all week.
I see a bear flag..
The price action in the white is the flag, the water fall in the yellow is the pole.
If we break that fib area of 54.78 you will see MASSIVE selling from the above stocks mentioned , especially Meta and NFLX.

XLC (Google and Meta)Outside its daily and weekly Bollinger bands..
Daily RSI at 80 while Money flow has been going south. That means smart money has been unloading here.
Looking for a gap close and pullback to trendline.

ETF's with stage two breakouts happening and ones already at GLBXLC ( communications ) stage two tryouts
SMH ( semiconductor ) stage two tryout
and XLF ( Financial ) stage two tryouts
In addition we have
PPA
KIE
PAVE
AIRR
FMIL
all in the GLB club ...
Bull market ~

XLCXLC – weekly vs. monthly
Weekly – after falling over 45% it appears to be forming a base; last week’s close was above previous weekly close from end of Nov 2022. While momentum indicators (MACD/RSI) are still negative but improving. RSI closed a fraction above 50 but MACD remains below the zero line.
Monthly – line chart shows potential for a double bottom; RSI higher high and MACD maybe ending its correction process.
Worth watching but looks encouraging!


XLC Rally into year endWith the triple zig zag correction nearly complete, we should see XLC rally into year end. Red line resistance is clear (5 hole).

Communications reach their bottomThe loss of basically 70% of post-covid bounce brings communications to fair valuations even amid gloomy guidances

$XLC a bottom bounce and an interesting observation. Happy Labor Day Weekend Chart Watchers.
Its been awhile since I last posted anything but I figured this would make for some good conversation. The Communications sector has been the worst performer YTD of all the SPDR sectors. This weekly chart shows that it might be at an inflection point. First, lets discuss the chart. I am a long term investor. I like to view things in terms of weeks, months and years. This is the chart I use 99% of the time. The chart is a weekly candle chart utilizing a 10 Period EMA moving average and a 40 period SMA moving average. These are my primary trend following tools. My primary oscillators are the RSI and the Mansfield RSI. I'm sure everyone is familiar with the RSI indicator. For those of you not familiar with the Mansfield RSI it is comparison tool with a 52 period moving average overlaid. Basically it is a ratio chart turned into an indicator and made popular by the Stage Analysis Method developed by Stan Weinstein. Most investors use "ABC/SPY" as their ratio comparison chart. I use ITOT as I like to compare the stocks I am looking at against the entire market, you get the idea.
XLC is roughly down 30% YTD. It is the 5th Largest Weighting in the S&P, not an insignificant sector. This chart shows the following: a sector clearly in a downtrend as it is below both moving averages. a weekly candle testing the support created by its previous closing low. As the sector made new lows from March through June, RSI clearly bottomed. The sector made a low in June and then tested its low again at the end of August (to the penny I might add). As this happened RSI swung higher and created a positive divergence. Very interesting!
I think this sector is setting up for a bounce higher going into the end if the year. The Mansfield indicator is still showing a sector suffering from underperformance. If you are someone looking for relative strength to confirm absolute strength then look for the Mansfield indicator to take out the 0.63 level.
Observations: if the worst performing sector of the year holds its lows while the overall market is under pressure does the S&P trade below its June lows? If the worst performing sector turns around and swings higher, what is the overall market doing in that scenario? Its probably moving higher. Obviously if this sector breaks lower then the June lows on the S&P are most likely taken out. However, the evidence as I see it today argues for lows to hold and for a swing higher into the end of the year. Happy Charting!!!
Thanks for reading. Good luck to all!


XLC, Short Market went into red trading mode on April 6th for QQQ, and on SPY as of today . That puts SPY and QQQ below their daily 21 ema's and I see some stage 4 downtrends in the works on certain groups too . XLC is one of the weakest groups .
To short something I want to see:
1)QQQ/SPY in downtrends and below their 21 emas , we have this .
2)LL ( lower lows ) and HL ( Higher lows ) structure and even better would be stage 4 DT's on instrument we are shorting , we have this too .
Risk will be managed similarly to my longs but I am going to sell 1/2 at 2R and then set a breakeven stop , whereas with my longs I am selling 1/3rd at 2R and maintaining original stop . I might change the short side trade management still getting my bearings with shorts .
Anyhow ,
XLC , Short
entry 61.17
initial target 64.27
risk 0.5%
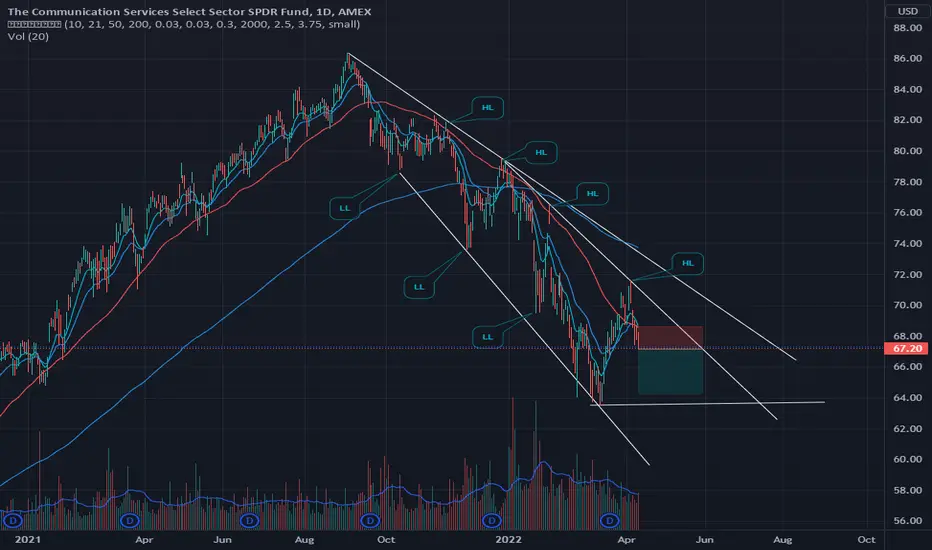
XLC trade for Meta and Alphabet exposureUsing XLC ETF to get exposure to Meta and Alphabet which is 40% of the fund. Taking advantage of the 61% drop from it's highs in Aug-Sep 2021, eventually the trend will change considering lower leverage of FB and GOOGL which is steady at 1.3 times it's Common Stock. FB has profit margin of 33% in 2021 which is high and has been fairly steady since 2017. Although ROE is sitting at 32% and 30% respectively for FB and GOOGL, the low leverage adds to its attractiveness. Considering we're entering a bear market, fundamentals are playing a key role in these growth stocks.

No long term gain but a possible exitCommunications are past it. Netflix reaction tells you a story. Overpriced not growing companies will keep on moving down. But a slight rebound is due
