$XOP Short IdeaContrarian trade with everyone screaming to buy Oil Energy and Gas right now.
Chart looks bearish to me and smells like distribution.
Natural Gas ripped yesterday and I took EQT profits and added to XOP JUN puts.
$136 first target
XOP trade ideas

$XOP Smells like distributionXOP to me needs to cool off after this monster up leg. Starting to smell like distribution with lower highs. A monster breakout is possible, but even being bullish I'd like a dip to $120 zone before the next up leg.
Daily - seeing some bearish divergence on the RSI
Weekly - top of channel rejection (so far) with Bearish MACD cross and momo turning down
Monthly - we're at the 2015 resistance line and an RSI approaching over bought territory
4HR - bearish divergence in MOMO and lower highs with MA turning down
I'm just not a buyer here, started a short position will add upon further confirmation JUN 130P
Cheers !

$XOP Swing ShortXOP looks like it's rolling over, or at the very least consolidating and heading back to sub 130 after rejection from trendline resistance and 30MA .
Whale trade short, bearish divergences on indicators. Price target sub $130

Arguments both ways...Patience... wait for some clarity... but I will be watching this to jump at some point in the coming days...


XOP Breakout watchLots of good looking stocks in the Oil and Gas sector. I couldnt decide on one so I went with the whole sector. .XOP220617C160

Breakout portfolio for a breaking down world.The world order established after WWII is changing before our eyes. Indexes have broken their uptrends. Nasdaq stocks have been crushed. Old commodities are becoming more important to nations than ever before. Security isn't guaranteed.
As investors our goals remain unchanged. Give ourselves and our families the best chance to succeed through financial independence.
Considering the changes in the world, I present to you five ETF's that when equally weighted as a single fund are breaking out to new all time highs.
$BUG - Cyber Security.
$XAR - Aerospace and Defense.
$XOP - Oil and Gas Explorers.
$XME - Metals and Mining.
$COPX - Copper Producers.
There's very little overlap between these funds. I prefer XAR to ITA due to the high Boeing exposure of ITA. The beta is high so expect moves greater then the indexes in either direction. When equally weighted there's a small yield of about 1%.
With ETF's you take the underperformers along with the outperformers. However, you don't have to worry to much about single stock risk. Stock pickers may prefer to dive into these funds and select the strongest stocks from the group.
I'm posting from my phone. Please excuse any errors.
Good luck to all.


$XOPCup waiting to form handle. With that said I would look for upside to this gas & oil etf until April/May then we should see a dip into the handle into the summer. So in my opinion gas & oil prices rise until the summer and drop until August if this pattern holds true.
CHART LEGEND:
white dashed lines = bull/bear takeovers
blue lines = call targets
yellow lines = put targets
red line = danger zone
orange lines = trend lines
green lines = safe zone
any other lines add will be discussed with the ticker
AMEX:XOP

XOP Energy Exploration + Production Outperformance to ContinueXOP is the ETF for the energy sector's oil and gas exploration and production sector. Despite the market indices (US) experiencing a high degree of volatility and technical damage, the energy sector has outperformed all other sectors in in 2022 (and late last year).
A cup with handle has formed, which is a bullish consolidation pattern made famous by legendary investor William O'Neil. Investors attempt to identify such patterns as signals that a higher move may be possible so long as a breakout past the pivot (the high of the handle on the cup) occurs and does not fail subsequently.
Other experts call it a volatility contraction pattern (VCP)—because when volatility contracts, it tends to then be followed by an increase in volatility, usually in the direction of the trend. The only caveat is that markets can sometimes derail breakouts from VCPs (cups with handles or other consolidation patterns).
Note how the trend in XOP is quite well defined going back to July 2021. XOP has respected the uptrend line across the lows (see the parallel channel above) And the price has been making higher highs and lower lows consistently since then. And momentum in the short-term is increasing, though I suspect all stocks may be dragged down to some extent by some of the market's downdrafts similar to what occurred in January 2022.
Recently, I started a small position using a vertical option spread to trade this to the upside into mid-March. I am keeping the position small until a better entry appears. I would add to the position at the 21-day EMA if it holds as support on any pullbacks.
In short, XOP appears to be a strong part of the leading sector in the US right now. While the markets may continue to experience volatile declines, it's worth watching XOP hold its trendline and MAs steady. It may be worth taking a bullish perspective on any pullbacks to the mean (the 21-day EMA, the 34-day EMA, et cetera).
Lastly, XOP's relative strength vs the S&P 500 and the Nasdaq is quite impressive. (An easy way to view relative strength is to do a ratio chart, called a "spread chart" by TradingView, by typing in the symbol XOP/SPX or XOP/NDX.)
DISCLAIMER: This content is for informational and educational purposes only. This should not be construed as financial advice or an investment recommendation. This content is not a substitute for advice from a licensed financial advisor or investment professional. Please do not trade options, stocks or other securities without understanding risk, position sizing, and the nature of the security product being traded. And please do your own research.

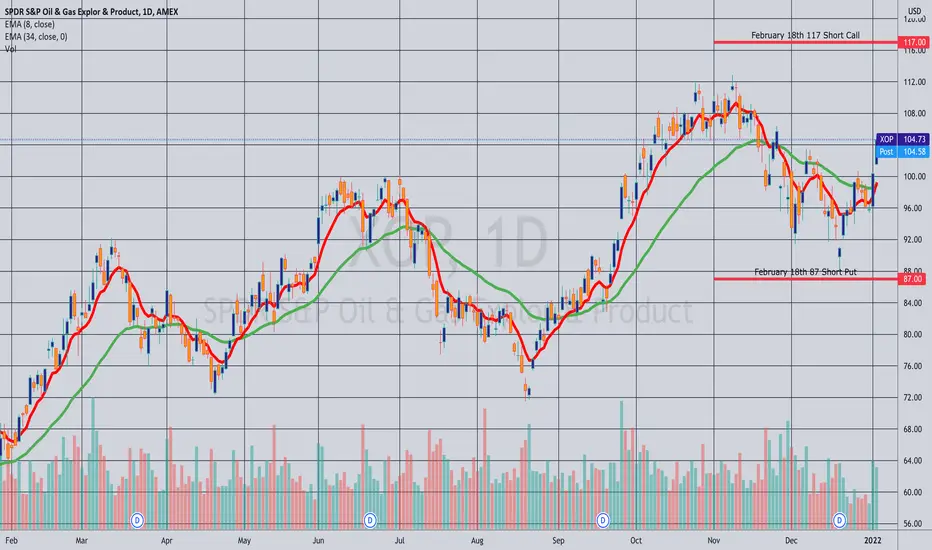
Closed: XOP February 18th 87/117 Short Strangle... for a 1.27 debit.
Comments: One of the only setups I didn't have to touch/adjust during all the January gyrations (i.e., no side was tested or approached worthless), but I had to wait on it longer than I would've liked. In for a 2.53 credit (See Post Below); out today at 50% max, 1.26 ($126) profit.

Trade Idea - $XOP - 3 Day Inside Bars- LT 110.06 - ST 101.173 Day Inside Bars
LT 110.06 - First Price Target $110.06
ST 101.17 - First Price Target $99.88
Options flow is mixed to bearish. Mostly calls sold.

Opened: XOP February 18th 87/117 Short Strangle... for a 2.53 credit.
Comments: High 30-day implied at 45.3%. 2.53 credit on buying power effect of 10.55 (on margin). 24.0% ROC at max; 12.0% ROC at 50% max. Will look to take profit at 50% max; manage sides on approaching worthless/side test.
Long Trade on XOP Trade on S&P ETF for US Crude
Opened the LNG in OCT as price was testing
the HLof the Longterm (M) Uptrend.
My STP-Loss was below the red line around 70
Price rallied for 11 weeks till it reached Resistance (top red line) I closed 1/2 the LNG to take
in Profit & control Greed.
Today as price broke the 102 Mark. I closed the other 1/2 of LNG

$XOP reaching resistance Area$XOP reaching resistance Area
Small pull back possible scenario from trendline.

XOP MonthlyHmm... breakout and backtest....
If inflation is stick and Oil makes a return to $100+... this could get pretty crazy.

$XOP Break the boxWatching XOP here for a breakout of the box. Nice volume pocket above with continuation of the follow through AVWAP. Blocks and Sweepers on the tape today over $1M in premium OCT and DEC opex.

$XOP price forecast on weekly chartLooks like the bottom is in. The orange trendline on the left seems to be broken and price went to $100, which is a key support/resistance and was rejected there.
I expect the price to climb to $140 which could be the end of wave 5. On it's way up there price needs to break and stay above the 200 MA (Red MA on the chart).
Blue lines on the chart are key price levels.
Right now price is sitting at the 50% retracement of wave 2-3 and looks like it found support there.
MACD on the weekly charts looks it is going to cross soon, which would signals a bullish move to the upside.

Stocks - Big Oil EarningsIdea for XOP:
- The reflation trade is dead - just a reminder:
- We saw big tech earnings in a (growth) deflationary environment:
- Now it's Big Oil earnings time.
GLHF
- DPT


𝗢&𝗚 𝗨𝗽𝗱𝗮𝘁𝗲: $XOP Weekly. ~99 Resistance HoldingResistance ~99 and 200ema holding. Possible 5-wave structure ended w/ divergence. Peak $CL_F seasonality passed too
$DRIP $GUSH $XOM $CVX $XLE $CL_F $USO $SCO $NG_F $UNG #ElliottWave #CrudeOil #OOTT 🛢️

Today Marks The Death Of The XOPXOP suck my butt. I short you. head & shoulders in the rsi. broken trend. Target around 89. LONG DRIP!

XOP to **pop** lolI think putting it in within such a 'channel', make sense. (It trades along with this "trend" (line, on top, since 2020), which is has never succeeded to break, yet). Expect it to follow this pattern in future (copy/paste the trend line). Follow the long averages.
(The bottom of channel is "bottom" of 2020 crash; and end of the initial "reflation trade" rally). Am not a professional, but you could use the both "trends"(lines) and use them as cycle indicators (overbought/oversold; bellow or above); It's currently "oversold", which, "may", appear on the longterm picture ahead.
//Maybe it will sell at the 2019 key level first.
//Hope it reaches the target by september or october. lfg
