XOP trade ideas


long or short? if breaks the support, i will add more. its not going below much from here. else will ride current long position. i will vote for long here

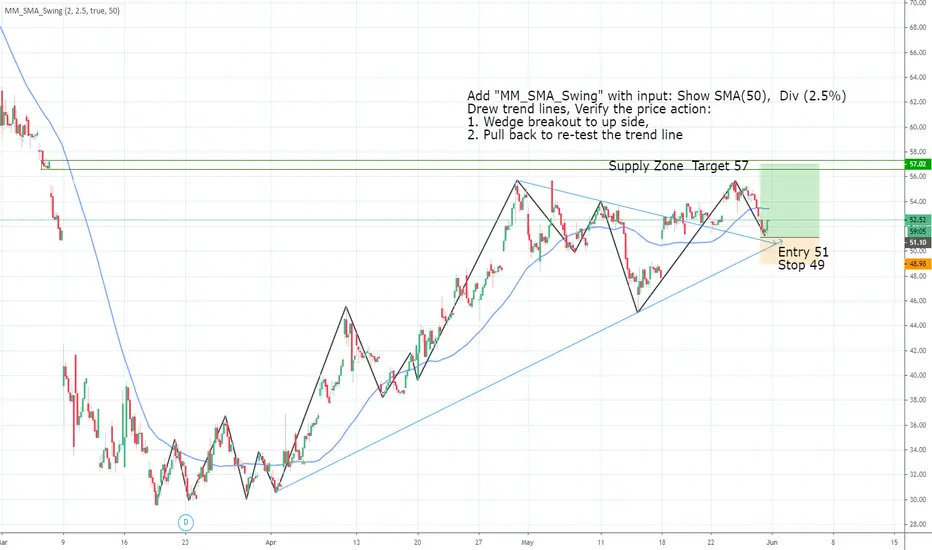
XOP Long, Using "MM_SMA_Swing" to find trading opportunityAdd "MM_SMA_Swing" with input: Show SMA(50), Div (2.5%)
Drew trend lines, Verify the price action:
1. Wedge breakout to up side,
2. Pull back to re-test the trend line
Entry: 51
Stop: 49; when trend line break
Target: 57; risk/reward=1:3
This is a trading school homework. I need few months to practice trading plan.
If you like it, thank you for your support. Please use SIM/Demo account to try it, until my trading plans get high winning rate.

Do Market Makers fill the gap next week?As always, idk what I'm doing. Just want to save this idea for the future. Let's see how it plays out. Let me know if you think I am way off base, or don't know anything.
RSI headed south while price still moving up slowly. Will the MMs fill that gap next week only to push it up again?
Looks like MMs averaged down in price earlier this week. May happen again before a move up to level 3


$XOP - Considering Going ShortIn w/ Back Ratio Spread on this.
What do I have to lose. If It moves to retest $40. I will make $$$, If it goes ape **** and runs away to $60 I will keep the tiny $ credit from the spread.
As long as it doesnt chop in a range. I make $, whether it is $ or $$$$ is a waiting game.

E&P vs Oil Ratio Points To Further Upside For Energy StocksExploration & Production (E&P) stocks have rallied nearly 90% in just a month and a half but their recent relative strength vs Crude Oil would suggest it could still have much further upside.
The correlation between the E&P vs Oil ratio & E&P Stocks has been very strong historically and is recently at its lowest level of all-time.
In order for this relationship to reassert itself we'll need to see prices either catch-up or catch-down to another. XOP USO CLM2020


$XOP oil E&Ps filling gap after huge surge with lousy WTI actionIronically oil & gas exploration and production stocks have rocketed higher in a period of oil commodity turmoil.

XOP Update from original idea posted March 2020We have given an update to our trading idea back on March 9, 2020. XOP is on the verge of a BUY Signal and an explosive move to the upside could be about to happen.

2 option tradeThe upside is 48
downside is M
You decide which side you gonna be
im going with the long side since the panic&events in the past hours are over
Goodluck


VERY RARE JACK O’ LANTERN PATTERN FORMED!Here we have a textbook Jack O’ Lantern pattern with SEVEN teeth which strongly confirms the validity of this setup. This is a once in a lifetime chance to trade a rare pattern which usually only forms during the fall season, so don’t miss this opportunity!
How do you usually trade the Jack O’ Lantern pattern? Let me know in the comments below!

Xop inverse head shouldersTrade based on the oil crude
If oil crude expect few big rallys in oxy and xo
Oxy already moving
Feel free to pm for any questions


XOP Long, using option strategyCondition:
Downtrend line was broken by Gap (G1).
It is closed now, not a strong breakaway Gap. At least, it shows little up side strength.
Trend line break (TLB) Entry:
Stop/market buy above the trend line TL1, (below 34.5)
Stop 0.5 below the trend line TL1, (about 32.5)
Target1: 40; risk/reward=1:2.7
Target2: 50; risk/reward=1:7
This is a trading school homework. I need 6 months to practice trading plan.
If you like it, thank you for your support. Please use SIM/Demo account to try it, until my trading plans get high winning rate.
Trading stock in this plan might be stopped too easily.
In my real trade, I use option Delta to simulate 40 shares of stock.
I bought Sep C40/50 (Delta 0.22), limit 2.55;
and Sell Sep P23 (Delta -0.18) limit 2.55;
stop when 23.
This option strategy is BFF "Buy For Free".
If XOP stays between 23 and 40. No winner, no loser.

XOP ETFFibonacci levels.
Disclaimer:
We are not registered or licensed in any jurisdiction whatsoever to provide investing advice or anything of an advisory or consultancy nature,
and are therefore are unqualified to give investment recommendations.
Always do your own research and consult with a licensed investment professional before investing.
This communication is never to be used as the basis of making investment decisions, and it is for entertainment purposes only.

XOP Looks VulnerableOil & Gas Exploration companies look vulnerable to another price decline. Call it a bear flag if you like, but this looks like a head and shoulders continuation to me. Is that a thing? Yeah it is

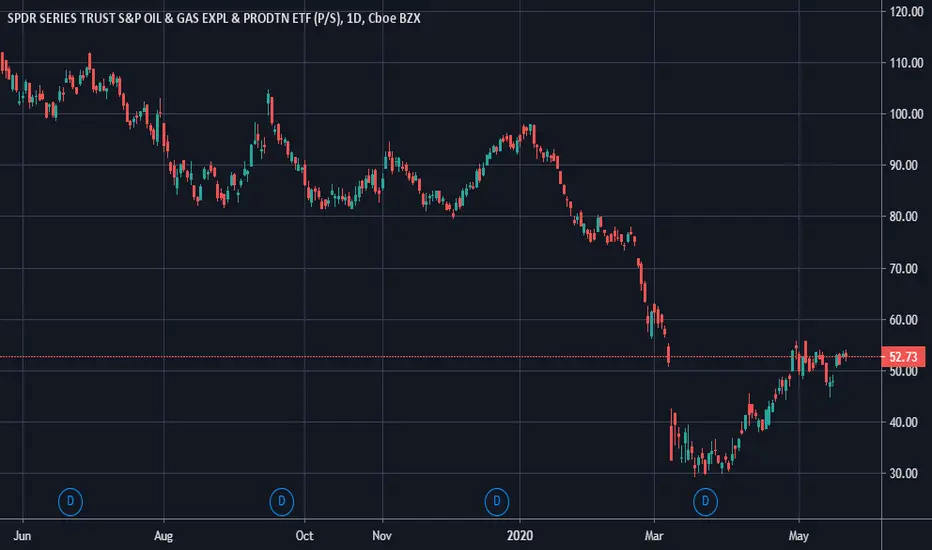
XOP 3/31 - SPDR SERIES TRUST S&P OIL & GAS EXPL & PRODTN ETFXOP 3/31 - SPDR SERIES TRUST S&P OIL & GAS EXPL & PRODTN ETF (P/S)
Potential to grow again to $61.56 (3/3). Price very Cheap and hold it. We're going to start seen grow and profit at soon the coronavirus disappear.
Different between: 61.56 - 32.66 = $28.90 per share
Excellent Profit!!!
