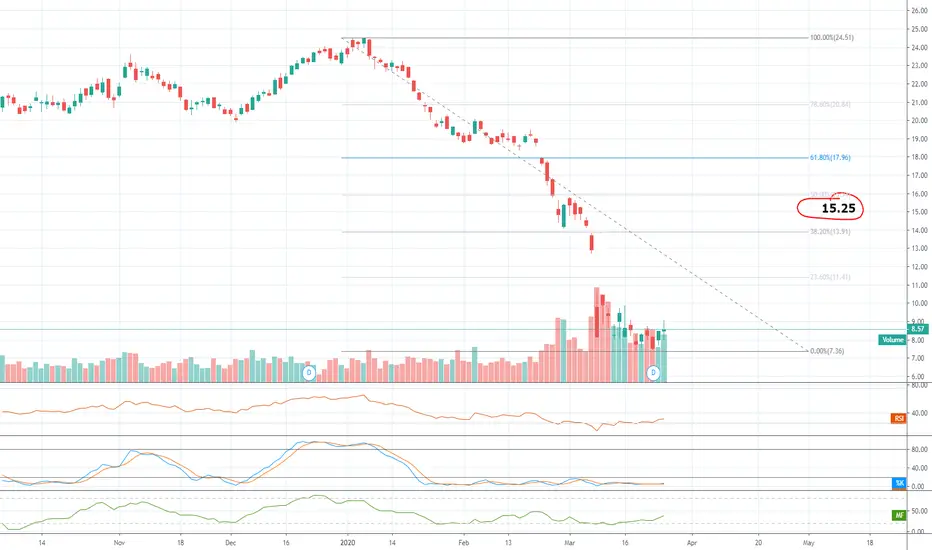
$XOP Bullish indicators targeting 15.25 at 2nd half of 2020If saved recent bottom at 7.25 . The wave shall take 80-90 days to almost double the bottom at 15.25 which can be extended to 17-18 .
XOP trade ideas
XOP forming two bullish channels, look for breakout- XOP is at all time lows
- You can wait to buy but finding support will be tough

XOP a clear buyAfter an onslaught against oil, this thing looks ready for a major reversal.
Falling wedge.
Multiple bullish divergences on recent lows on every time frame.
Macd about to cross over on the daily.
I’m hoping I can jump in below 8.50 tomorrow morning.
First target is the gap fill at 12.7.


XOP / GDX is not oversold yet, but...The crash in oil is dictated by fundamentals - demand in freefall and production forecast off the charts due to price war.
Gold has not been acting as a hedge pretty much against anything, given it is actually sold as a source of liquidation funds.
Short oil and long gold seems a trend to continue in the short term from a pure technical standpoint.
Contrary theses and conditions for a bounce in the next few months:
1) Gold crashes after the impact of Coronavirus abides
2) Oil jumps because of end of price war

2014-15 period as a guide to current environment2014-15 vs today
Seeing the first impact from virus and oil shocks now
If it plays like 2014 we can see a bounce in risk assets soon BUT the worst will come later in a few months


ROLLING: XOP MARCH 20TH 21/31P TO JUNE 19TH... for a .48 credit and selling the June 19th 23 call against for .32. Scratch at 9.20; delta/theta 146.51/.93.
Notes: Was hoping to get a bounce such that the 21P was out of the money, but am going to roll out here and then continue to reduce net delta/cost basis over time ... .

XOP to validate support and cross the previous resistanceOnce XOP Proves support and passes previous resistance worth a 2-3wk call to $20.50-$21. Else XOP will retest support and if the bottom falls see the next support isn't until $18.50 - $18 range. Personal thoughts, is XOP will finally have a couple green days and see XOP test resistance at $20.50-$20.75, however won't be touching until proven pass of previous resistance.


CLOSING: XOP MARCH 20TH 24 SHORT CALL... for a .05 debit.
Notes: Scratch at 8.45. Will look at rolling out the 21P, 31P next week and then re-upping short calls to cut net delta and reduce cost basis further. Alternatively, I can just wait and see what happens running into expiry, with the most likely outcome that I get assigned on at least the 31 and possibly on both the 21 and 31, with the obvious advantage to staying in the options being the buying power effect as compared to being in the stock.

Hoping for a bounce soon XOPthis has ruined so many ppls life including me. It needs some reversal now

A bounce to the upside is highly probable at this level.This week, a bounce in XOP is highly probable based on the support levels and the sideways range we have most recently seen it trading within.

CLOSING: XOP MARCH 20TH 25, 26 SHORT CALLS... for a .09 debit; scratch at 8.50.
Notes: Not much value left in these, so taking them off. Waiting for a little while longer on the 24 shortie.

CLOSING: XOP MARCH 21ST 27 SHORT CALL... for a .05 debit.
Notes: Here, just stripping off some approaching worthless short call. Because my scratch here is 8.59, I'm not going to do a ton further with it running into March expiry, except to strip off "approaching worthless" options. This is because the most likely scenario is assignment on the 31 short put, where my cost basis is 31 minus 8.59 or 22.41 versus 21.89 spot. I'm fine with that, since the underlying is toward the end of range lows.

XOP: Oil & Gas Fund Clings to SupportThe stock market's been undeniably strong, but energy has been the weakest link. Of the 11 major sectors, energy remains at or near the bottom of the rankings. (It's also the only one under its 200-day SMA)
The S&P Oil & Gas Exploration ETF is a heavily traded name within the broader energy space. It averages almost 2x more options on a daily basis than the better known XLE: 122,000 contracts in the last month vs 76,000 for XLE , according to TradeStation data.
XOP's MACD has been declining since early in the year and it's now trying to hold the $23 level where it peaked in early November. This sets up the potential for a break to the downside and a retest of the December lows around $20.
The energy market has struggled with a supply glut. Just this week both the EIA and the IEA had bearish news. The EIA, part of the U.S. government, said domestic oil production passed 13 million barrels for the first time ever. Weekly data also showed big inventories of unused refined products. The IEA, a global organization, separately predicted non-OPEC supply will keep swelling.
Throw in a potential of calmer tensions in the Middle East, and the risk/reward may favor weakness in this corner of the market.

OPENING: XOP MARCH 20TH 26 SHORT CALL... for a .43 credit. Scratch at 9.08.
Notes: A delta under hedge as this whips back "the other way." Still slightly net delta long.

The forsaken sector - Oil and GasThis is one sector that is pretty depressed since April 19 or even Oct 18 since it peak at 45 and have plunged to a low of 20 in early Dec this year.
The multiple bottoms at 20.38 show evidence that it has reached its bottom and price is going to catch up to its glorious days like before. When? Your guess is as good as mine.
(etfdb.com)
Here, you can see the components of XOP. The advantage is you need not check out individual company as there are way too many listed.
When the price action breaks above the resistance level at 24.15, I will be happy to load more.
See you at the TOP.

OPENING: XOP MARCH 20TH 21 SHORT PUT... for a .36 credit.
Notes: A delta hedge against my XOP position in the first expiry that pays greater than 10% of the value of the stock. Delta/theta -4.94/3.22, with 3.19 extrinsic and setup value of 10.19 versus 8.64 scratch.

XOP, FRAK, and PSCE are potential winners from Iran conflictThe oil sector has been mixed today as investors weigh the likely consequences of war with Iran. On the one hand, oil prices are way up, which should be good for energy. On the other hand, a lot of the big oil companies have operations in Iran and Iraq that could be disrupted by military conflict.
So which companies might benefit from rising oil prices without so much exposure to the Middle East? First of all, domestic production companies like shale and offshore drillers. Second, clean energy companies. And third, oil and gas exploration companies. It's tempting to go with a clean energy ETF, but those are trading at a relatively high P/E right now and don't pay much in the way of dividends.
Instead, I have three ETF suggestions:
1) XOP, an oil and gas exploration ETF. These trades at an extreme discount right now, with a P/E below 5 and a price-to-book ratio of 0.62. That price-to-book ratio means that that you're paying way less for these companies than their assets are worth. If they closed up shop tomorrow and sold off their assets, you'd actually *make* money on that. Plus it pays a 1.5% dividend.
2) FRAK, an "unconventional" oil and gas ETF with a lot of shale companies. The P/E and P/B are higher than XOP, but still attractive at 8.44 and 0.98. The dividend is about the same at 1.5%.
3) PSCE, a small- and micro-cap energy ETF, with a P/E and P/B slightly lower than XOP, at 4.36 and 0.51. This one has actually been the biggest winner today, with a gain of 2.3% vs. about 1.4% in the other two ETFs. However, the dividend distribution is quite a bit lower, at about 0.4%.
Perhaps even better than an ETF would be to look at the top holdings of each of these funds and see which have reacted best to the news, and which individual companies have good dividends, valuation, and execution.

$XOP - wait for Bearish Cypher to complete, then go shortAMEX:XOP - forming nice Bearish Cypher, short when it is complete

Bare NecessitiesHere's your metals and your energies!
High R/R longs, who knows.
World in the state that it is, and troops in the five figures being prepped to go overseas to fight for resources, this could be your portfolio hedge against the neocons succeeding.
