XOP trade ideas


Oil/Oil Service Cyclical Bottom? Dow Dog ready to bark back.XOP has been in a Bear Market for a little over a year now due to recession fears, trade wars, and over production by frackers.
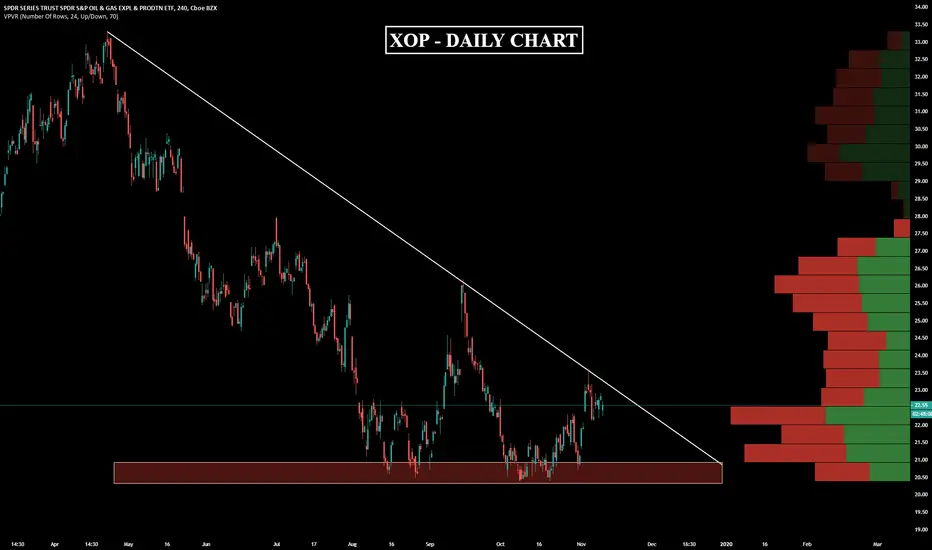
When you look at the XOP chart we see what appears to be a bottoming picture developing. The massive trend line that has kept price going lower for some time is now in play. OPEC cut backs and post year end window dressing conclusion I believe may lead to a break out in the XOP fueling even stronger gains in the 3x GUSH. 3 mos. plus we may see a double for the XOP from these over sold levels (imho).


XOP - BB% Cross UpEntry was at $20.88.
Stop is $20.25
Target for 2R is $22.11
Trading using options.
Bought 3 Call 20 DEC 19 contracts @ .63 per contract.
Target is 50% profit / loss per contract + a little extra for fees
Profit: $0.97 per contract
Loss: $0.30 per contract


OPENING: XOP MARCH 20TH 28 SHORT CALL... for a .58/contract credit.
Notes: One of my troubled setups that I seem to have been working forever (See Post Below) and probably could've gotten out of sooner if I'd been a touch more aggressive on the call side as the underlying descended to long-term lows. Rather than inverting the short strangle further, I'm leaving the setup in place and adding a delta cutter.
Scratch at 7.36, delta/theta 40.7/1.38.


XOP - DAILY CHARTXOP - SPDR S&P Oil & Gas Exploration & Production ETF
The ETFs seems poised to be affected by the recent news regarding the Oil output, that it's increasing due to the latest report from Iran that discovered a new oil field with over 50 billion barrels, plus the announcement from OPEC + that isn't going to cut its Oil output for now. Working in favor of the asset we have for now only the perspective of increase of revenue on this quarter due the Winter season, but this its a weak argument compared to the current geopolitical context.


SYMMETRICAL TRIANGLE ON XOPThe chart shows the analisys of a Simmetrical Triangle for XOP in ETF Market using 1 day of timeline. The trend is continuous and descending, the upper dide of the triangle is touched by Points 1,2 and 3 and the lower side is touched by Points 4,5,6 and 7. A break out point occurs and it is time to open a short position.

Possible Reversal of XOP (Oil & Gas Exploration & Production)Here we have an enormous falling wedge pattern with a textbook Elliot Wave ending diagonal. We also have bullish divergences. If TA is our guide the upside could be at least 70%.


XOP: Plan to LONG XOP for two weeksPlan to buy CALL on Monday Open, then keep it for two weeks.
details information @
youtu.be


XOP Forms a Potential Bear TrapThe Oil and Gas Exploration and Production industry has been hammered. I typically have no interest in weak sectors...until there's a potential bear trap which sets up a major bullish opportunity. That setup could be underway now.
A few weeks ago XOP broke below the 2016 low, consolidated, and has since jumped back above the 2016 low. This was on massive volume. Volume has been escalating, and in July and August, it looks like the bulls threw in the towel as the price went below the 2016 low. This has been followed by even larger volume to the upside this week. A nice shift from fearful and excessive supply to hungry demand.
The profit target is a relatively conservative estimate from this oversold condition. But of course, we'll have to see. This a medium-term trade, and will likely take 9 to 18 months to unfold.
Disclosure: Likely initiating a long this week.

XOP: will buy XOP around tomorrow noon Sep/10 2019Maybe before EIA report, there will be a good enty
