ZBRA | Long | Software-Led Breakout Setup | (Aug 2025)ZBRA | Long | Software-Led Breakout Setup | (Aug 2025)
1️⃣ Short Insight Summary:
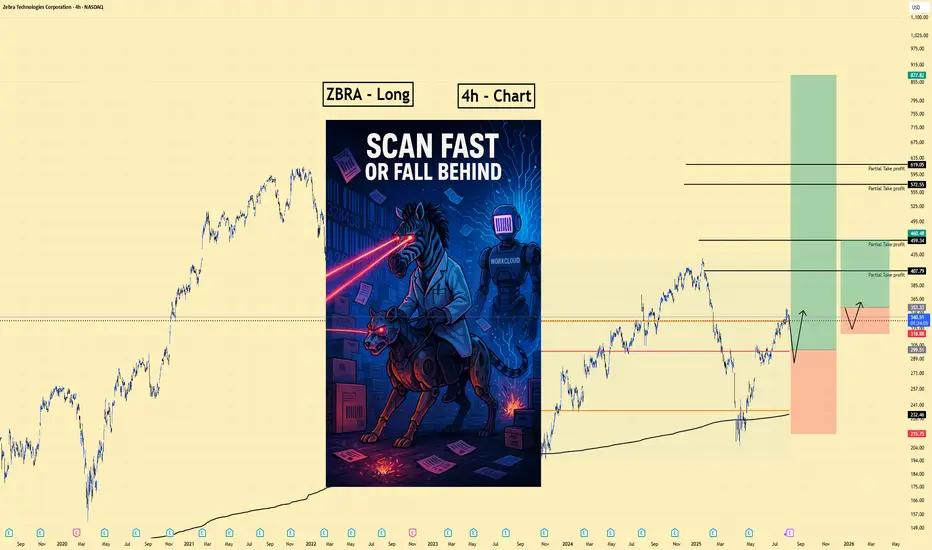
ZBRA looks ready for a powerful move if it reclaims the $215 zone after a retest. With strong product momentum and a growing software/services business, this could be a breakout opportunity in the making.
2️⃣ Trade Parameters:
Bias: Long
Primary Entry: $215 (confirmed breakout and hold above)
Alternate Entry (Pullback Buy): Around $200–209 if price dips before continuation
Stop Loss: $190–195 (tight risk control under structure)
TP1: $247
TP2: $459
TP3: $572
TP4: $619
TP5: $800+ (multi-year structural upside)
3️⃣ Key Notes:
✅ Strong bounce potential if price reclaims $215 after recent weakness
✅ Long-term bullish structure with AI/software tailwinds (Workcloud, Google Cloud partnerships, new AI retail suite)
✅ Financials remain solid despite macro pressure (EPS beat, double-digit segment growth, 80% Fortune 500 clients)
❌ If price runs past $215 without retest, I won’t chase—waiting for setup confirmation
❌ Slow YoY revenue growth still a concern vs peers (watch how software rollout performs in H2 2025)
4️⃣ 💡 If this idea reaches 10+ likes 👍, I’ll post a detailed follow-up chart analysis with volume and risk management overlays!
Please LIKE 👍, FOLLOW ✅, SHARE 🙌 and COMMENT ✍ if you enjoy this idea! Every interaction helps keep the content free, pushes it to more traders, and motivates me to post deeper analysis here on TradingView.
Disclaimer: This is not financial advice. Always conduct your own research. This content may include enhancements made using AI.
ZBRA trade ideas
On my watchlist as a reversal candidate.There have been four analysts price upgrades this morning so I'm watching for trend reversal
signals in the coming days. Could make for a nice play long.
I hope the Bollinger Band goes into a consolidation pattern for price to stabilize and then break to the upside. I put colored arrows on the chart to illustrate.
I'll update here when I see something interesting.

Zebra Technologies (ZBRA) AnalysisCompany Overview: Zebra Technologies NASDAQ:ZBRA is making significant strides in AI integration within its enterprise asset intelligence and data capture services. The company is positioning itself as a leader in AI-driven innovation, with broad applications across multiple sectors. CEO Bill Burns has emphasized the strong rebound in enterprise mobile computing, reflecting sustained demand for Zebra’s innovative solutions.
Key Catalysts:
AI Integration: The use of AI in enterprise solutions is key to Zebra’s growth strategy. By enhancing its asset intelligence and data capture services, Zebra is positioned to lead in industries such as logistics, retail, and healthcare. AI can drive operational efficiency and improve decision-making for its clients, increasing demand for its advanced technologies.
Strong Enterprise Demand: The rebound in enterprise mobile computing across verticals signals long-term demand for Zebra's mobile and automation solutions, further solidifying its market leadership.
Productivity and Cost Savings Plan: Zebra’s 2024 Productivity Plan and Voluntary Retirement Plan aim to achieve $120 million in annualized savings, which should lead to improved profitability. These cost-saving measures could enhance both gross margins and operational efficiency, providing additional capital for strategic investments in technology.
Investment Outlook: Bullish Outlook: We are bullish on ZBRA above $340.00-$345.00, with the integration of AI in its services, coupled with cost-saving initiatives, positioning the company for sustained growth. Upside Potential: Our upside target is $500.00-$510.00, driven by increased AI adoption, strong demand in mobile computing, and the financial benefits from its productivity and cost-reduction efforts.
🚀 ZBRA—Leading the Future with AI and Enterprise Intelligence. #AIInnovation #MobileComputing #CostEfficiency

$NASDAQ:ZBRA AI Stock Swing trade playNASDAQ:ZBRA Forming a higher low above MA200 and Inverse H and S to add conviction. Let's see how it plays.

ZEBRA Stock Chart Fibonacci Analysis 032923 Trading Idea
1) Find a FIBO slingshot
2) Check FIBO 61.80% level
3) Entry Point > 291/61.80%

ZBRA tested the MA200 and rejected it.ZBRA rejected MA200 and could step up. The Company has provided solid fundamental grounds for it in the latest EPS report.
#notfinancialadvise #adjustyoursize

$ZBRA with a Bearish outlook following its earnings #Stocks The PEAD projected a Bearish outlook for $ZBRA after a Negative Under reaction following its earnings release placing the stock in drift D with an expected accuracy of 87.5%.

$ZBRA with a Bearish outlook following its earnings #Stocks The PEAD projected a Bearish outlook for $ZBRA after a Negative Under reaction following its earnings release placing the stock in drift D with an expected accuracy of 100%.

ZBRA - Recurring Pattern Green leading to Red top repeating
The initial red top is in the same position of the second green bottom, this is what the horizontal lines are used for
This pattern could continue, but for now we are just focused on the bearish wave currently being experienced from the red top
Almost like a Zebra pattern (green and red though instead of white and black)

Bear FlagZBRA is quite a bit off the high of 615 with the low of the impulse wave up being 150.06. Long impulse wave for sure.
A channel up type of structure formed after a significant move to the downside, also known as a bear flag. This pattern is a neutral one and price can break to the upside. Price has broken to the downside.
There are different ways of calculating targets for a flag, but most use the length of the pole to guesstimate targets.
Small gap down which may fill. Plenty of resistance overhead.
Price was in a small horizontal trading channel at it's top and the 20 simple moving average crossed down through the 50 inside of the rectangle top. Some would have seen this as a solid sell signal if they wanted to get out at the top.
Price is close to falling out of the Bollinger bands set on an 80 DMA. This can also be an oversold signal. Sometimes a fall below the bands can cause a small pop to the upside, and sometimes even up to the middle band in favorable market conditions. The bands follow price.
No recommendation.
Possible Target 1 in larger orange type below price. T2 is in smaller type if T1 is passed and so on.
Possible AB=CD structure forming.

$ZBRA with a Bearish outlook following its earnings #Stocks The PEAD projected a Bearish outlook for $ZBRA after a Negative Under reaction following its earnings release placing the stock in drift D with an expected accuracy of 100%.

ZBRA Short-Term LongWe just finished 1-5 Elliot wave and waiting to complete ABC correction we forecast that finish of ABC correction will be around 356 zone, since there is a strong demand zone and we can see institutional candle in a lower time frames.
Entry: 356
Invalidation: 330
Target: 470
Ratio: 4.38

$ZBRA play puts under 440.NASDAQ:ZBRA ZBRA is sitting at last support with a big gap in the next volume shelf. If we stay here above 440, things can reverse. My bet is on the gap-fill under before any uptrend. As usual watch QQQ before taking the play on either side.
Puts under 440.

ZBRA Blue Sky Bull Flag FormingZBRA has been forming a nice earnings flag for the last month near new all time highs, could not ask for more out of a stock
One to keep on a radar when its ready to push up through ATHs

ZbraThat correction should be 4th.
now the plane, on the basis of this we conclude that it is also a local four.
The target is slightly higher than the possible 5, but the price is trending very strongly


ZBRA: ASCENDING TRIANGLE - BIG MOVEZBRA :
Ascending triangle forming on Zbra.
To avoid fake breakout, wait for a move above 518 to enter a long position.
Potential move of usd 90 to the target zone mentioned on the chart.
Note that the pattern can fail if the overall market drops.
Trade safe.

Zebra Breakout ZBRA breakout on above average volume. Chart showing a VCP type pattern with single digit last pullback.


Upside potential on ZBRAA breakout could see good upside.
P.S: It's not a recommendation to buy/sell

