ZM a long entry at fibonacci levelZM long at this price, risking the lows of this trend. Great last earnings release, I think ZM will be hereafter COVID
ZM trade ideas

ZM back to pre-pandemic level just like IBB BiotechZM & IBB Biotech have both came back down to 2019 pre-pandemic levels.
Pls see my previous ZM post for the chart of IBB. Sorry got confused by similar chart.
ZM just BO above the falling wedge.
Some consolidation probable as ZM may be bottoming.
Not trading recommendation

$ZM with a Bearish outlook following its earnings #Stocks The PEAD projected a Bearish outlook for $ZM after a Negative Under reaction following its earnings release placing the stock in drift D.

Zoom out the Zoom..! The past 3 yearsI think whatever you need to know about a Formation of bubbles and their burst you can see in the ZM chart:
An 805% move in 18 months followed by an 84% decline in the next 17 months:
During that 84% decline, you see a 36% and 48% positive surge, but the aftermath remained the same..!
Even a significant change in the fundamental did not help:
But ZM was not alone, other examples are:
NIO: +5500% followed by -80%
DOCU:
And the mother of All bubbles:
ARKK:
and the Final point:
Gauging Market Changes
The key determinant of whether the market is bull or bear is not just the market's knee-jerk reaction to a particular event, but how it's performing over the long term. Small movements only represent a short-term trend or a market correction. Whether or not there is going to be a bull market or a bear market can only be determined over a longer time period.
However, not all long movements in the market can be characterized as bull or bear. Sometimes a market may go through a period of stagnation as it tries to find direction. In this case, a series of upward and downward movements would actually cancel-out gains and losses resulting in a flat market trend.(Investopedia)
Conclusion:
You can be in the Bearish market yet see the most Exotic Bullish rallies..!
Best,
Dr. Moshkelgosha M.D
DISCLAIMER
I’m not a certified financial planner/advisor, a certified financial analyst, an economist, a CPA, an accountant, or a lawyer. I’m not a finance professional through formal education. The contents on this site are for informational purposes only and do not constitute financial, accounting, or legal advice. I can’t promise that the information shared on my posts is appropriate for you or anyone else. By using this site, you agree to hold me harmless from any ramifications, financial or otherwise, that occur to you as a result of acting on information found on this site.
*I have open positions in SARK(74.36), SOXS(40), TZA(30.60)

Gap Fill to take us down 36%Showing extreme amounts of bearish divergence on the daily, breaking immediate trendline and bearishly engulfing on the daily a pullback to the $326 area seems likely.


ZM Weekly low-risk areasWeekly Bat with Fib levels showing targets. Still oversold on RSI - MACD looking ready to prime for more positive MOMO

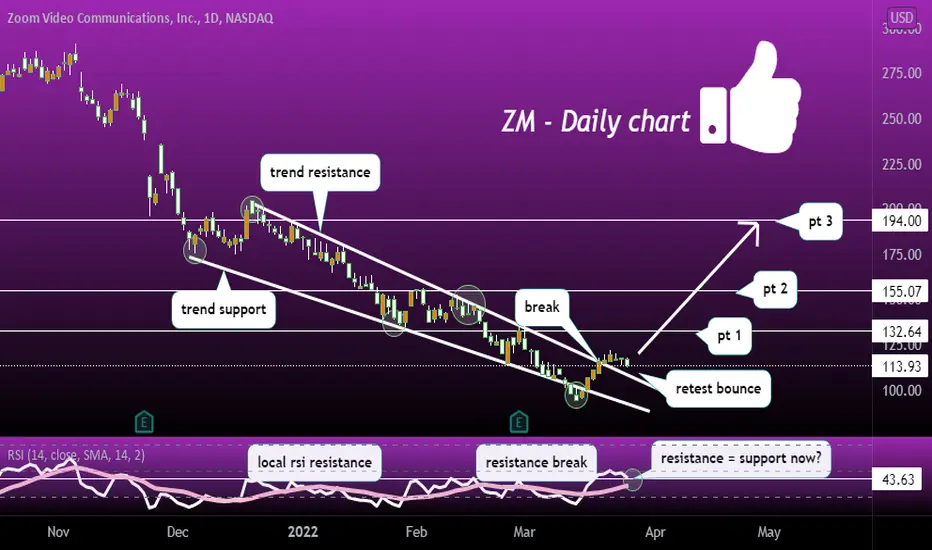
could retest bounce, one of my favorite chart patterns! ZM broke trend/rsi resistance lately, is this the retest bounce (perfect entry)?
Its possible, but time will tell. potential targets are 132.64-155.07-194.00
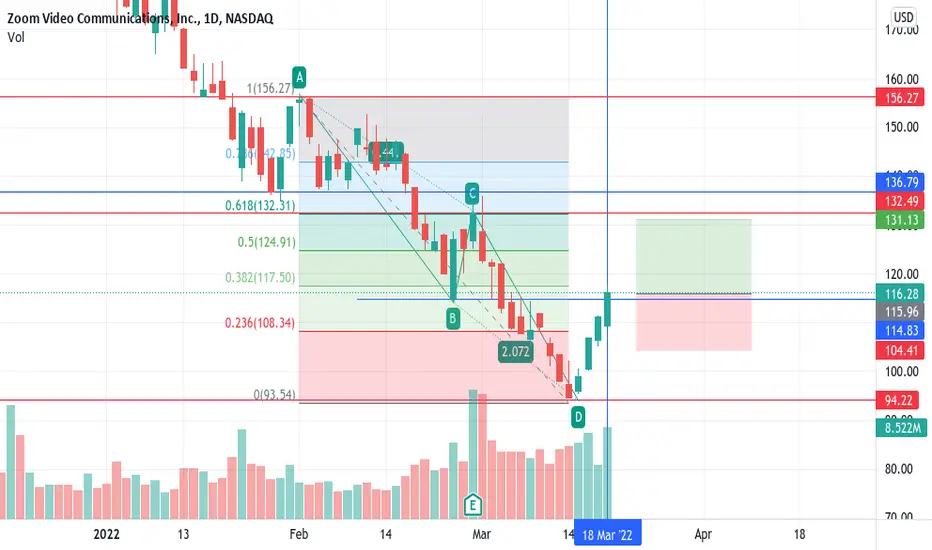
ZM short then long (way long)After a very nice couple of days ZM is setup for a slight fall. The two purple boxes show recent gaps and I suspect one if not both of these will likely fill in the next day or 2 (or 3). Below those you can see some yellow dotted lines which are also gaps from early 2020 before COVID hit. Will those fill too? Not sure - we were very close the other day when the stock got to 94.51. I thought for sure that ~91-92 gap would fill, but it turned out that we created new gaps on the way up instead, so now there are 4 gaps below where we are now and as you can see on the chart, we are about to hit the apex of a small ascending wedge.
That said, if you zoom out over the last year you will see that we are also in a massive DESCENDING wedge as well, and assuming we do go down short term, it should only be temporary before we see a breakout squeeze. If you actually look at where the wedge converges, you'll see it is right in the range of the lowest gap, about $76.70 or so. Will it actually get that low? I don't know, I think it is possible if the people that have been saying SPY is going to 385 end up being right, but I think no matter what happens it is looking like a setup for a squeeze. FYI I don't see it getting lower than $75, there is hard support line there from 2019. Also just a disclaimer that my arrows are not pointing to any specific number targets, they are just going in the general direction that I am predicting.

the best sapurt and going up i just lerning and i am not good on stock but i just start i thing it will go up and the sapurt is very clera

ZOOM will be ZOOMING SOON!ZOOM should head up in Wave C to $1,000
Target should be reached by 26th Sep 2022
Invalidation: 60.97
GOODLUCK!


Zoom Long NowWeekly RSI is hovering around 16, major bullish divergence on several indicators, ZM just hit major support from several years back. At minimum we see a large bounce here likely $120-130 at which point I will likely exit, wait for the next drop, and go long for a long term hold if I like the setup.

Zoom Video (NASDAQ: $ZM) Showing Bullish Divergence On RSI! 💻Zoom Video Communications, Inc. provides a video-first communications platform in the Americas, the Asia Pacific, Europe, the Middle East, and Africa. The company offers Zoom Meetings that offers HD video, voice, chat, and content sharing through mobile devices, desktops, laptops, telephones, and conference room systems; Zoom Phone, an enterprise cloud phone system that provides secure call routing, call queuing, call detail reports, call recording, call quality monitoring, voicemail, switch to video, and other services, as well as inbound and outbound calling services; and Zoom Chat enables to share messages, images, audio files, and content in desktop, laptop, tablet, and mobile devices for meeting and phone customers. It also provides Zoom Rooms, a software-based conference room system; Zoom Conference Room Connector, a gateway for SIP/H.323 endpoints to join Zoom meetings; Zoom Video Webinars to provide video presentations to large audiences from many devices; and Zoom Hardware-as-a-Service allows users to access video communication technology with subscription options for phone and meeting room hardware. The company offers Zoom for Developers to integrate its video, phone, chat, and content sharing into other applications, as well as manages Zoom accounts; Zoom App Marketplace enhance developers to publish their apps; OnZoom, a platform for users to create, host, and monetize online events; and Zoom Apps to access from Zoom Meetings and the Zoom Desktop client to facilitate collaboration and engagement during meetings. It serves individuals; and education, entertainment/media, enterprise infrastructure, finance, government, healthcare, manufacturing, non-profit/not for profit and social impact, retail/consumer products, and software/Internet industries. The company was formerly known as Zoom Communications, Inc. and changed its name to Zoom Video Communications, Inc. in May 2012. The company was incorporated in 2011 and is headquartered in San Jose, California.

Zoom - Gas prices up. Remote work may be on the rise again!Whales/elites will not miss any opportunities into making money. They simply buy the fear, hype up the market, take profit and crash it again after taking profit. Instead of beating then, lets ride with them! ;)
Before reading, get rid of your moonboy mentality and no emotions for dips/corrections! Cannot rule bearish scenarios! Dips are for buying!!
People are so focused on the hourly/daily timeframe that they get emotional on every dip! Take a step back to the weekly/monthly timeframe and see why I'm so bullish now. Stop looking at the short-term dips/rise. Short term is irrelevant for the move that is coming!
You can't be emotional in these markets (stocks, forex, crypto, real estate, etc.). You will lose this game following the news and doing what the majority does. News creates emotions. Everything you need to know are on the charts. News is manipulated by the elites, and they take advantage of our emotions. Stop listening to the news and pay more attention to the charts. Don't follow the majority, because the majority will lose in the end! Also, don't buy the hype when everyone is buying.. instead buy the fear when everyone else is selling
Everything is on the chart! Cryptocurrencies are on the verge of exploding higher. Dips/Corrections are normal and needed in a bull market and are buying opportunities! Huge gains opportunity in the coming months! Never trade blindly. Use multiple indicators to make calculated decisions. Trade with no emotions!
Facts:
1. As gas prices skyrockets, remote work may be on the rise again!
2. RSI - Historical low on the RSI (currently at 17!). Highly oversold on the weekly!
3. Stochastic RSI - both lines reached its low. Waiting for the bullish cross and above the 20 level for bullish confirmation!
4. We are coming down to the past Resistance that became support in 2020!
"If you can't beat the fear, do it scared!"
"Be fearful when others are greedy, and greedy when others are fearful!" - Warren Buffet.
"Markets are a device for transferring money from the impatient to the patient. - Warren Buffet
"Show me the charts, and I'll tell you the news." - Bernard Baruch
"The secret to investing/trading is figuring out how rich you want to be and how poor you're willing to become."
"If you want to live like the 5% of the population who are hugely successful, then don't act like the 95%!"

$ZM, Zoom is at the all time .886 retracementZoom Video is at the all time .886 retracement.
One could buy this here for his longterm depot and just let it sit and grow.
Stay safe !

I'm still using these guys at work...Let's just say, it's a good company, and I like the technicals.
I'll be looking for a reversal pattern to confirm long.
Updates to come!

ZOOM (ZM)| Possible Short-term Rejection Area!Hi,
Just an idea to look for fundamentals because Zoom's price trades near $100. Technical analysis suggests that we can see a short-term rejection from the shown area.
Criteria:
1. Round number $100
2. Channel projection
3. AB=CD
4. Fibo Extension
5. Previously worked resistance level becomes support
6. Possible rejection from the bottom of the range
Do your own analysis and be cautious!
Regards,
Vaido

ZoombiesZoom on track to rise from the dead as it reaches a fair value determined by the Graham Lynch model back in 2021.
As pointed out prior to the looming bubble pop
Tipping momentum is indicated by the MACD reaching up to the zero bound amidst price decline
A retrace towards 200 is the near term target

Crazy Price Action on ZOOMWhat a perfect chart pattern! The sell off from the nose bleed levels of $500 plus was astounding. This is a classic technical and fundamental analysis of a company that became incredibly overvalued and massively overbought. This looks like half of the stocks that have been corrected over the past 6 months. As the market correction continues we could see ZOOM down to $75 bucks a share.
I shorted ZOOM back in Feb, 2021... I should have posted this original chart back then. Anyway... this is just a perfect example of a high probability short.

ZM Should reach 137 after earning.ZM Should reach 137 after earning, bottom is in and not much resistance in sight. I think has a chance to go way beyond that if the numbers are good. Stoploss just below support.

ZOOM ,DO NOT HESITATE.JUST BUY ITi think foundamentaly zoom is undervalue.the price has retested before pandemic level.although during the pandemic,the company made a lot of profits .besides from now on, remote working will be used as a serious method.
I am used to analyze charts in a simple way.lets look at chart:
technically there are six reasons why i am optimistic that the trend will be reversed:
1.the price is near the very strong static support line (demand area) in the weekly time frame.
2.the price has supported with dynamic support line(the green one).
3.the price is on the bottom of desend chanell.
4. strong bullish divergence has happend between Price & Rsi(i have shown it with a red line on price and rsi indicator).
5.bullish candels has shown in daily time farme(engulfing candel) in daily time farme& hammer candel stik in weekly time frame (not complete yet) on the price action level.
6.RSI is in oversold area in the weekly time farme.
