ZTS: Continuation of an uptrend.The continuation of the uptrend may have a target in the region of 210. Perhaps, it will be possible to buy stocks on rollbacks downward. Also, pullbacks down can give ideas for medium-term deals with small targets.
ZTS trade ideas

ZTS: Breakout Confirmed, 12.46% Potential Profit!Description: ZTS is trending higher and in an uptrend meaning that highs are getting higher and lows are getting higher. The uptrend line on the chart and the Trending Band Indicator (which measures trend) supports the Long Position.
Stats:
1. Ideal buy range: $165.9 - $170.9
2. Take profit: $189.04
3. Stop Loss: $163.06
4. Risk To Reward: 1 / 4
5. Accuracy Rating: 97%

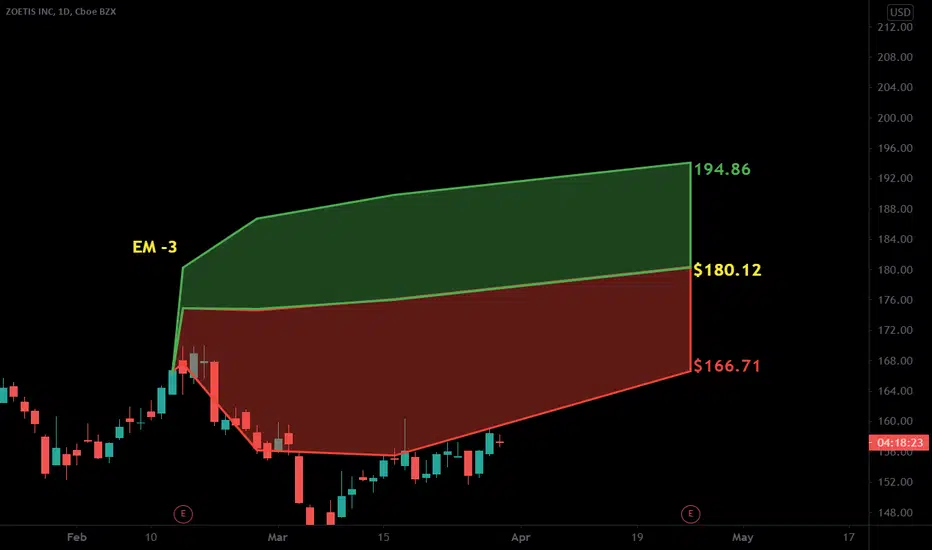
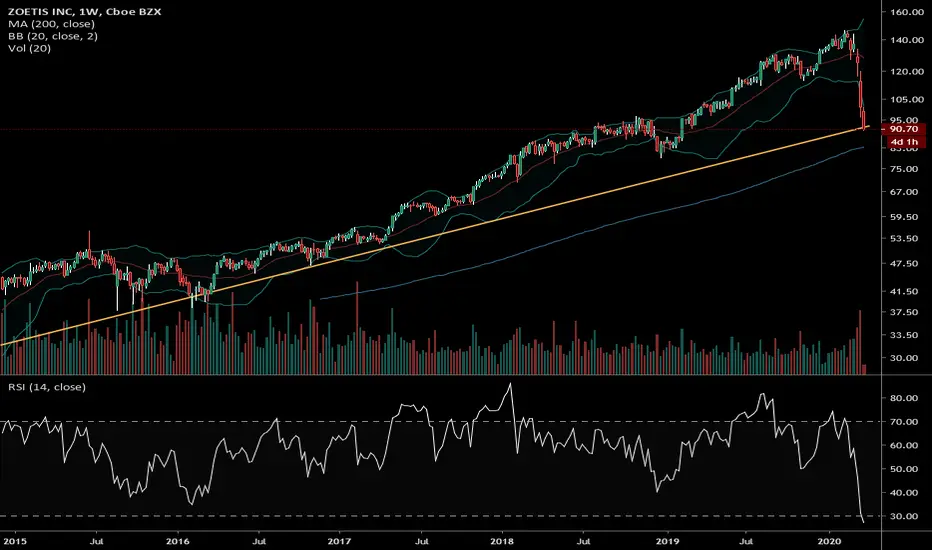
ZTS: Bear Algo Entry III (and Final)I've developed a bearish algorithm/screener that screens for stocks with identified selling pressure / trend followed by a dead cat bounce that is likely to fail - which we will attempt to short. I'm trying to combine trend following and VFI trading principles for the coming bear market.
Components:
1. 200 EMA: below current market price (this is so we don't get stuck in short squeezes and such)
2. 50 day moving average above current market price (we want past clearly identified weakness over a sufficiently long period)
3. 10 day moving average below current price (we want a stock that has attempted to rally from the lows)
4. CMF<-0.1 (we want to screen out bottoming patterns such as Inverse Head and Shoulders whenever we can)
5. Moving Averages Ratings: Buy, Neutral, Sell - we don't anything with strong MA momentum indicators, and we don't want to be short squeezed.
6. Market Cap, Price, volume requirements

$ZTS with a Bullish outlook following its earnings #Stocks The PEAD projected a Bullish outlook for $ZTS after a Positive under reaction following its earnings release placing the stock in drift A
If you would like to see the Drift for another stock please message us. Also click on the Like Button if this was useful and follow us or join us.
ZTS ReversalSquat Bar & Wide Adv Vol
T1:173.75
T2: 178.45
Watch Absorption zone.
B setup, below monthly VWAP No LVN


Solid earnings winner Great pattern on the daily. Looks good through 168 with a stop under 164.
Looking at a medium-term base breakout to the upside. Not a very fast mover but we should be looking at a good 5-6 points at least if all goes well.
Sorry for not posting as much I have been avoiding trades due to the election

ZTS Broadening Bottom (bullish)I found this pattern at tickeron website with the following data:
STATUS = Confirmed
CURRENT CONFIDENCE = 66%
TARGET (EXIT) PRICE = 166.29 USD
BREAKOUT (ENTRY) PRICE = 162.17 USD
DISTANCE TO TARGET PRICE = 2.83%
EMERGED ON = Sep 24, 12:00 PM (EDT)
CONFIRMED ON = Sep 28, 09:30 AM (EDT)
WITH CONFIDENCE LEVEL = 74%
A broadening bottom can be characterized as a bullish reversal pattern. It consists of two divergent lines that form a triangle. The movements between the two triangle sides increase as the pattern continues. Each side must be touched at least twice to be validated.
The Broadening Bottom pattern is formed when the price of a security progressively makes higher highs (2, 4) and lower lows (1, 3, 5) following two widening trend lines. The price is expected to move up or down past the pattern depending on which line is broken first. What distinguishes a Broadening Bottom from a Broadening Top is that the price of the security is declining prior to entering the pattern formation.
Once the price breaks out from the top pattern boundary, day traders and swing traders should trade with an UP trend. Consider buying a security or a call option at the upward breakout price/entry point. To identify an exit, compute the target price by adding the pattern height (H on the chart) to the breakout price. The pattern height is the difference between the pattern’s highest high and its lowest low.
To limit potential loss when the price suddenly goes in the wrong direction, consider placing a stop order to sell at or below the breakout price.
This type of formation happens when volatility is high or increasing, and when the price of a security is moving with high volatility but with little or no direction. It can potentially indicate growing investor nervousness and indecisiveness.

DAILY ANALYSIS OF ZOETIS INCHi friends
the daily chart of this market shows with a strong probability an uptrend in the coming days but it is also necessary to be vigilant of the change towards the opposite direction
please subscribe to receive more analyzes


ZOETIS This OpportunityHey traders, **DISCLAIMER** content on this analysis is subject to change at any time without notice, and is provided for the sole purpose of assisting traders to make independent investment decisions. signal of purchase in progress, plausible that buyers continue to push.
Please LIKE & FOLLOW, thank you!

Going Long Zoetis - My dog's allergy med maker. I'm going long ZTS. Goodluck.. Trade at your own risk. $126 Calls look good.


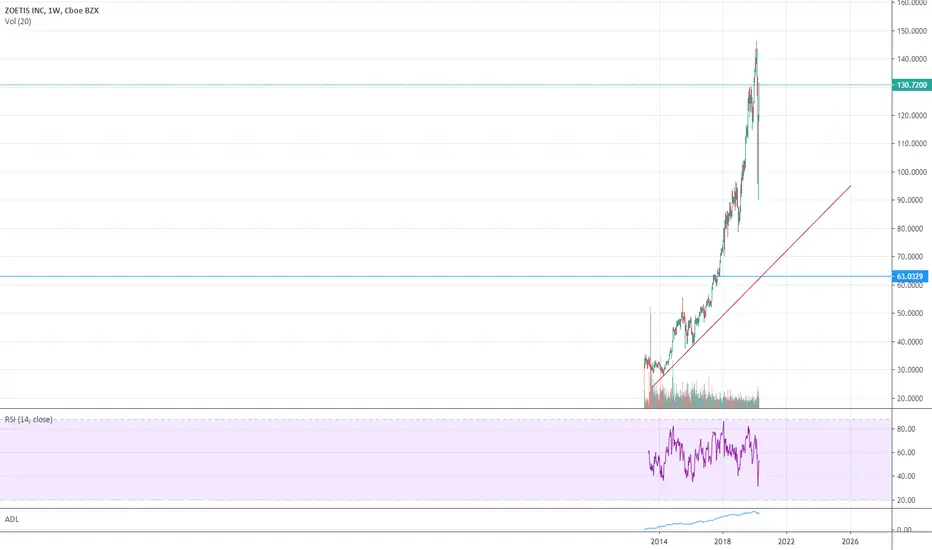
SHORT Short by put option to weekly level support $63SHORT Short by put option to weekly level support $63
$ZTS long ideaThis was the only bullish set-up that I was able to find in my scans. I like it long over $128 for a potential push up to $132ish tmrw. I'd recommend playing this with half your usual risk and to be quick with either taking profits. Don't much trust longs at the moment.

ZOETIS $ZTSZoetis stock is as animal-health products remain "essential" despite the coronavirus pandemic.
forming Head and Shoulders?

ZTS ShortBought a single put Nov 22 EXP strike was 119.
Just a quick trade, max loss is $100 max gain is $300 looks like it'll go lower to $114-115. Exit will be next Friday.

ZTS Put SpreadZTS put spread 125/120 Cost is $1.5
Max gain is $175/ $325 at sale of option or $3.25 Limit already set GTC
Max loss will be taken October 14th end of day if my options plan is a failure.
Max loss is $113
Bearish divergence it seems to be trending lower will see how it plays out.
